Are your data pipelines slowing down your business? Can they handle increasing data volumes, real-time processing demands, and ensure end-to-end visibility? For many organizations, the answer is no. Traditional data pipelines are rigid and complex, making it difficult to adapt to evolving business needs. They require specialized IT expertise, are costly to maintain, and often lead to delays in data extraction and real-time data handling. Worse, the lack of Data Pipeline Observability means data quality issues often go undetected until they impact critical business processes.
These limitations don’t just create technical bottlenecks—they directly affect business outcomes. Complex integrations slow down insights, while schema dependence makes pipelines fragile and difficult to scale. Without Data Pipeline Observability, identifying and resolving data issues becomes a time-consuming process, increasing the risk of inaccurate reporting and missed business opportunities. As a result, organizations struggle to make timely decisions, miss growth opportunities, and face rising operational costs.
Modern data pipelines overcome these challenges. They offer a more flexible, automated approach to collecting, transforming, and delivering data. With built-in pipeline observability, businesses gain real-time monitoring, faster issue detection, and greater transparency across the entire data lifecycle. This enhanced visibility allows organizations to extract value from their data faster, drive smarter decisions, and scale without the technical burden of legacy systems.
What is Data Pipeline Observability?
Data pipeline observability is the ability to monitor, track, and analyze data as it moves through each stage of a pipeline. It goes beyond basic monitoring by providing real-time insights into data quality, performance, and integrity—helping you detect issues, optimize processes, and ensure reliable data delivery.
Think of it as having a detailed map of your entire data pipeline. It shows where data comes from, how it’s transformed, and where problems might occur. Whether it’s a failed transformation or unexpected data anomalies, observability helps you identify and resolve issues quickly, ensuring your pipelines deliver accurate, trustworthy data for business decisions.
Without observability, data pipelines are a black box—errors go unnoticed until they cause damage. With observability, you gain complete visibility and can maintain data quality and healthy, efficient pipelines that drive better outcomes.
Data pipeline observability refers to the ability to monitor, track, and analyze data as it flows through the pipeline, providing real-time insights into data quality, performance, and integrity. It involves collecting and analyzing data from various points in the pipeline to identify issues, optimize processes, and ensure data reliability.
Why is Data Pipeline Observability Important?
Without clear visibility into your data pipelines, even small errors can cascade into major business problems. Broken transformations, missing data, or delayed processes can undermine decision-making and disrupt critical workflows. Data pipeline observability addresses these challenges by providing continuous insights into how data moves, transforms, and performs—ensuring that your data remains accurate, reliable, and actionable.
Data pipeline observability offers several key benefits:
- Enhanced Data Visibility: Observability allows organizations to break down data silos and gain a holistic understanding of their data landscape, enabling more effective utilization of data in BI and analytics workloads.
- Adapting to Data Changes: As the business environment evolves, data observability provides insights into data changes, empowering organizations to adapt and stay relevant in dynamic markets.
- Proactive Issue Detection: By closely monitoring data pipelines, data teams can identify and address issues early on, ensuring data quality and preventing downstream impacts on analytical results.
- Minimizing Downtime: Data observability tools help organizations detect and mitigate data quality issues promptly, reducing “data downtime” and ensuring data reliability.
In a rapidly expanding analytics industry, where data volume is increasing exponentially, pipeline observability is crucial for organizations betting their business on data and the pipelines that run it. By investing in observability, data engineering teams can gain visibility into pipeline transformations, diagnose issues efficiently, and maintain data stability, ultimately driving better business decisions.
How Does Data Observability Work in Data Pipelines?
Data observability acts as a watchful eye on your entire data pipeline, from start to finish.
At the front end, it monitors data health across various sources, ensuring all data types (structured & unstructured) are ingested cleanly. It achieves this through standardization and data quality management, fixing inaccuracies and converting unstructured data for smooth system use.
Throughout the pipeline, it tracks system performance in real-time, monitoring memory usage, CPU, storage, and data flow. This vigilance allows for early detection and resolution of data-related issues, maximizing system performance, without data downtime, especially when handling large data volumes. Additionally, data observability identifies inconsistencies by comparing pipeline events, helping pinpoint potential flaws before they snowball into major problems.
Finally, at the back end, data observability ensures clean, accurate data delivery for valuable user insights. It even leverages AI/ML to manage resources, predict usage trends, and control IT costs. This ensures a smooth-flowing data pipeline, always delivering the insights your business needs.
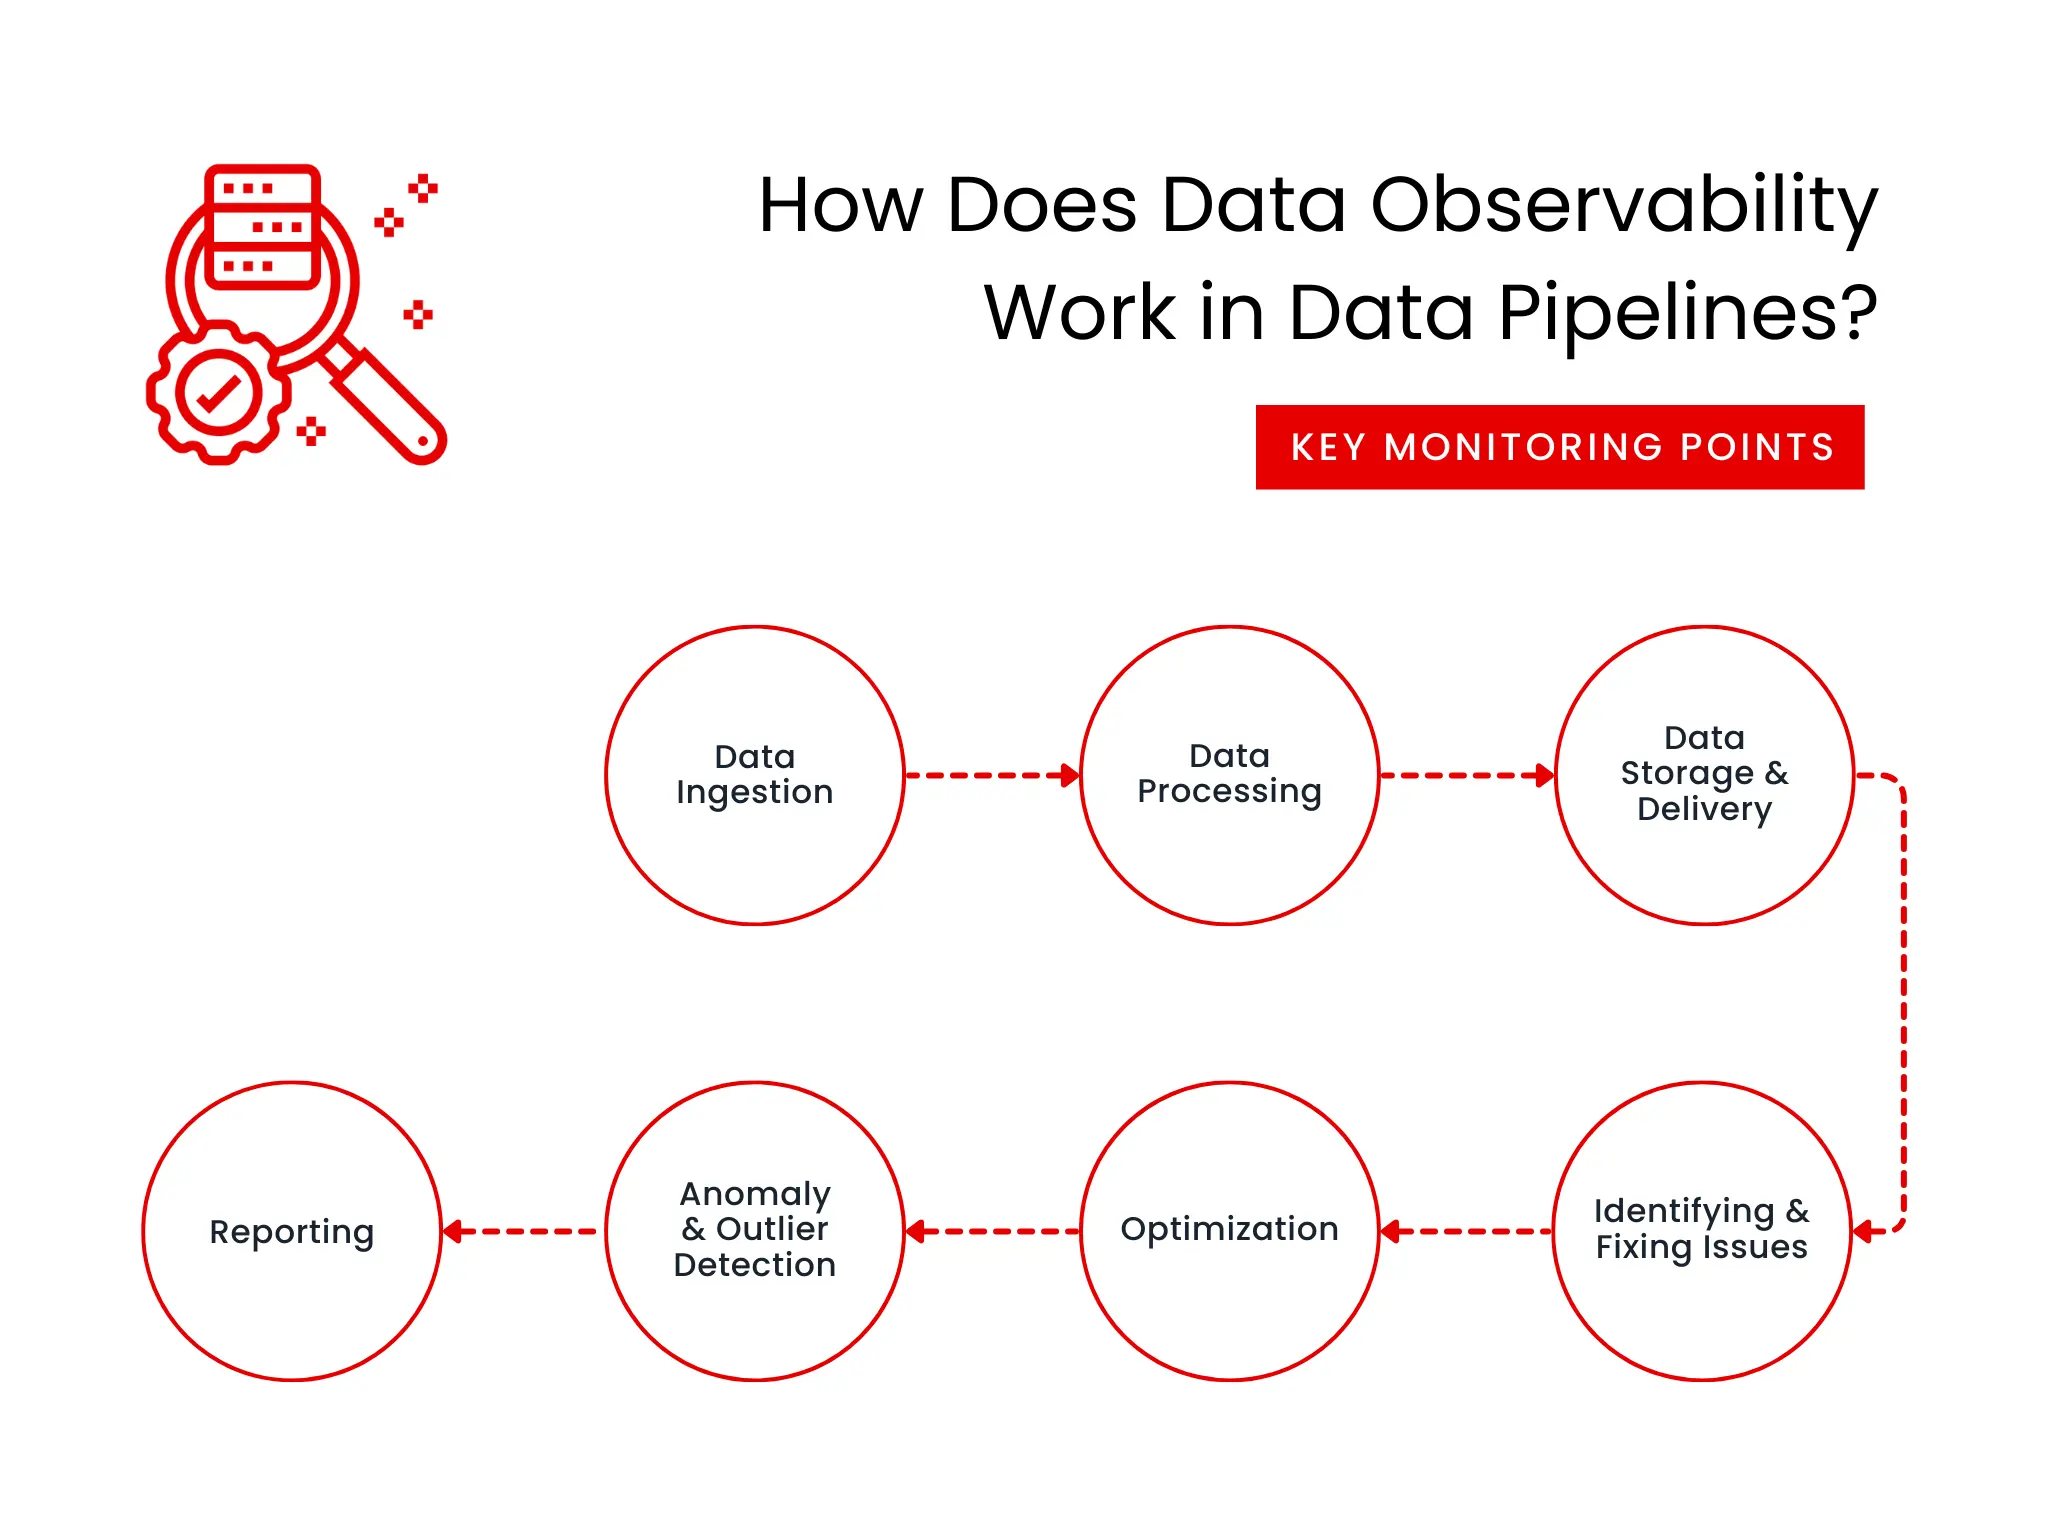
Here’s a breakdown of key monitoring points and how data pipeline observability helps:
- Data Ingestion: Track data volume, processing speed, and errors to ensure smooth data entry.
- Data Processing: Monitor each stage of your data movement for failures, latency, resource usage, and proper data transformation.
- Data Storage & Delivery: Observe data delivery speed, destination accuracy, and alert to potential issues.
- Identifying & Fixing Issues: Identify error locations, root causes, and potential fixes for faster resolution.
- Optimization: Find bottlenecks and optimize resource usage for faster processing.
- Anomaly & Outlier Detection: Uncover unusual occurrences that might signal problems or improvement areas.
- Reporting: Receive real-time alerts for potential issues and generate reports for overall pipeline health.
Read: See how observability matters for AI readiness here.
Features of Modern Data Pipelines
- Continuous Insights with Real-Time Processing: Gone are the days of waiting hours or days for data updates. Modern pipelines continuously ingest and process data, providing near real-time insights. This allows businesses to react swiftly to evolving trends and opportunities. Imagine a company that can leverage real-time social media data to identify trending topics and capitalize on them before they fade.
- Cloud-Enabled Scalability and Agility: Leveraging the cloud’s inherent elasticity, modern pipelines automatically scale resources based on data volume. This eliminates the need for expensive upfront hardware investments and ensures optimal performance during peak periods. Additionally, cloud-based pipelines simplify deployment and management for geographically dispersed teams.
- Isolated Resources for Streamlined Performance: Modern pipelines utilize multiple isolated clusters for processing, transformation, and analytics. This prevents resource contention and ensures high performance for each workload. Deliver faster results without bottlenecks with separate processing lines working simultaneously on the same data set.
- Democratizing Data Access and Empowering Users: Modern pipelines empower users to access and manage data with user-friendly tools. This reduces reliance on specialized data engineers and fosters self-service analytics. Business users can leverage SQL-like interfaces to build and modify data pipelines, accelerating the discovery of valuable insights.
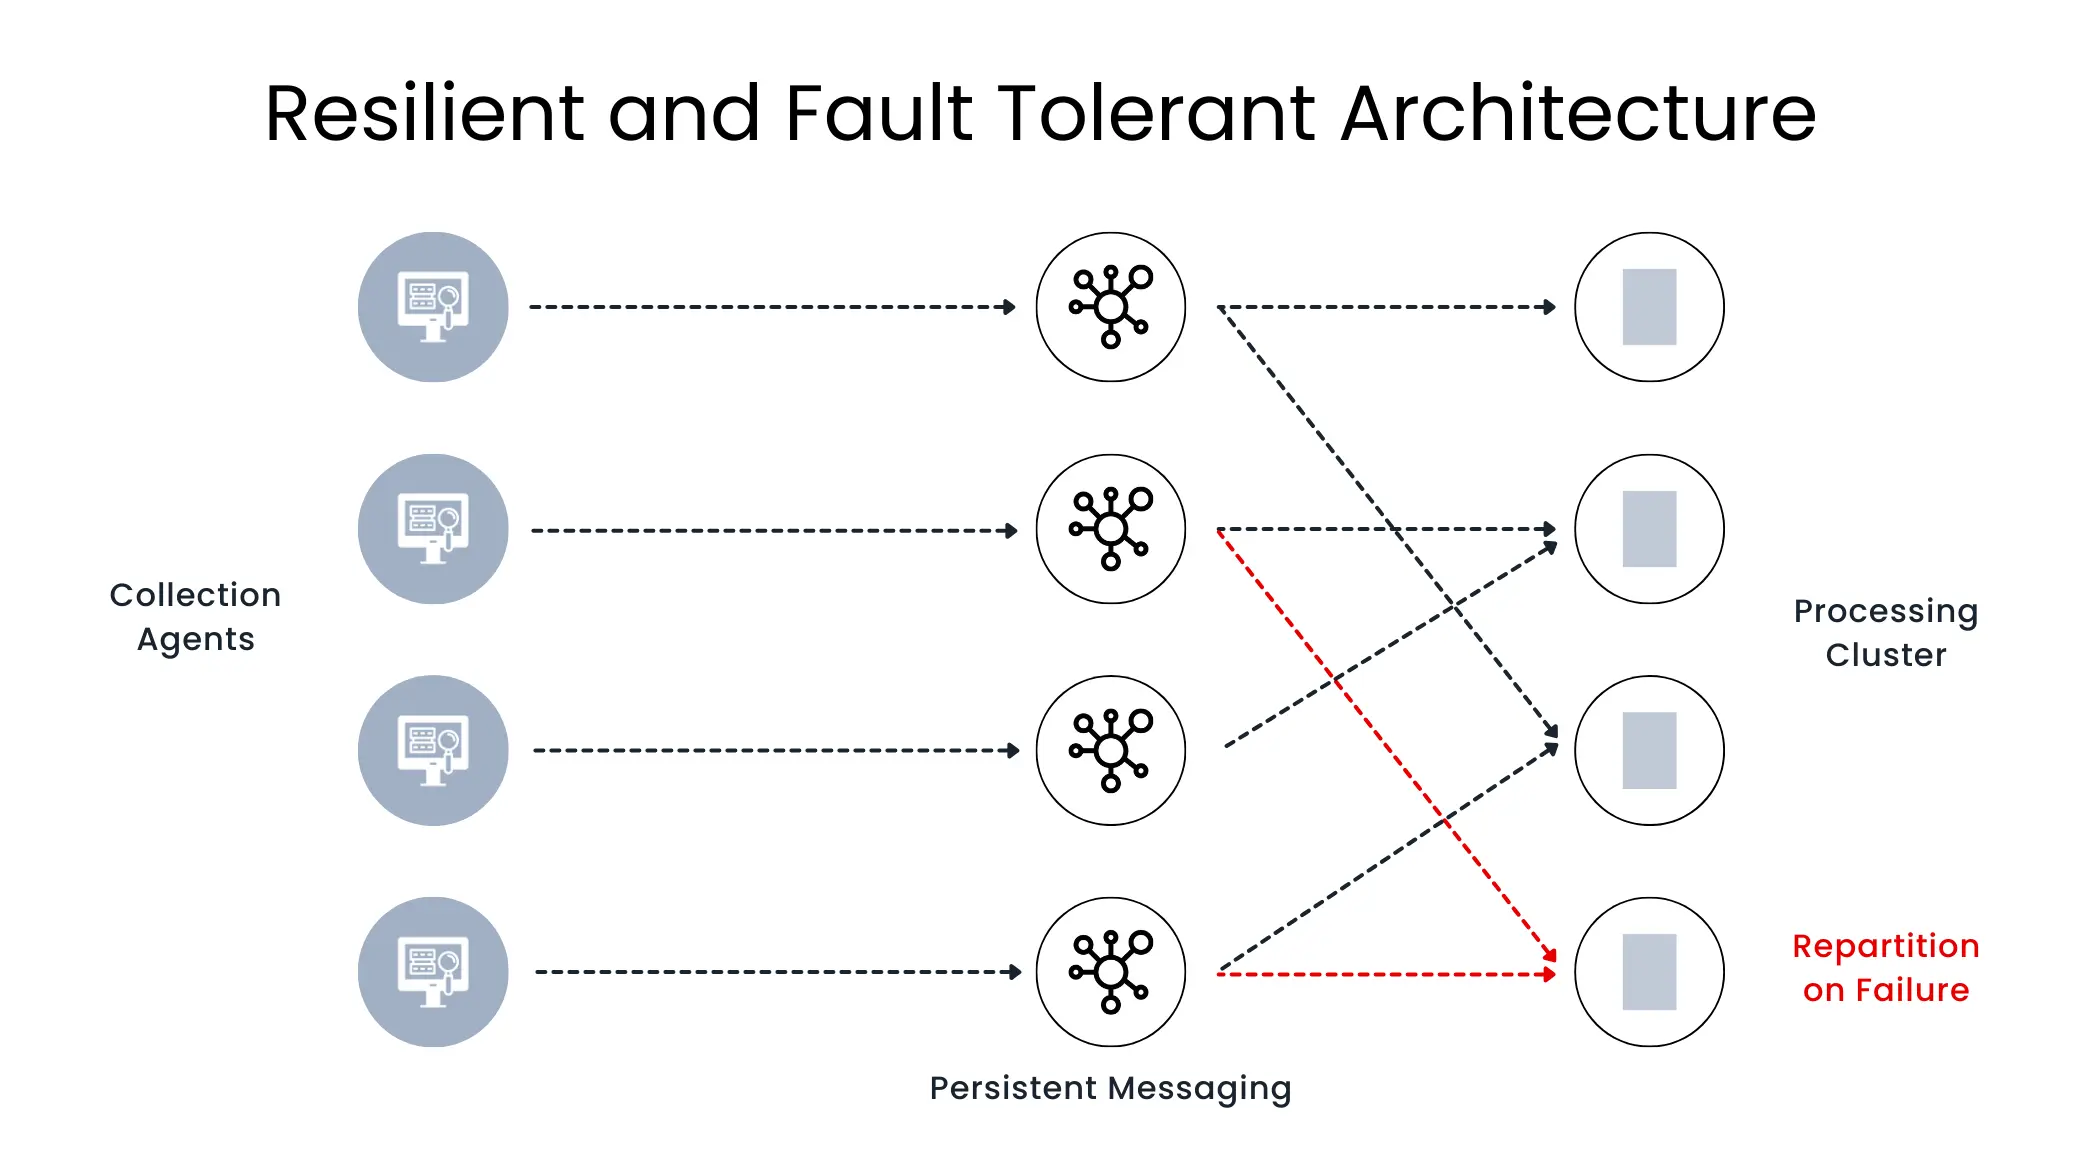
- Built-in Resilience for High Availability: Modern pipelines offer built-in redundancy and failover mechanisms within the cloud environment. This ensures data availability and minimizes downtime in case of disruptions. Businesses can experience faster data recovery and minimize the financial impact of potential outages.
- Exactly-Once Processing (EOP): Data pipelines are susceptible to errors during data transfer. Modern pipelines address this by incorporating advanced checkpointing capabilities. These checkpoints ensure that no data events are missed or processed twice, safeguarding data integrity.
- Self-Service Management for Efficiency: Modern pipelines are built using a collection of interconnected tools. These tools, ranging from data integration platforms to data lakes, enable teams to create and maintain pipelines in a self-service and automated manner. This eliminates the need for complex manual integration and streamlines ongoing maintenance.
Such modern data pipelines demand a proactive approach to ensure their health. This means going beyond reactive monitoring and equipping data engineers with real-time insights and actionable recommendations to identify and address potential issues before they snowball.
Essential Components for Data Pipeline Observability
To achieve comprehensive observability, a combination of monitoring tools and techniques is essential. Here are the key components that enable effective pipeline observability:
Core Monitoring Tools
- End-to-End Monitoring: These platforms track metrics across the entire pipeline, from data ingestion to storage. This holistic view ensures smooth performance and swift issue resolution at every stage as it offers a comprehensive understanding of your system health.
- Real-Time Monitoring: Designed for streaming data pipelines handling live data, these tools ensure timely processing and alert for delays. By enabling immediate response to anomalies, they safeguard data integrity and operational efficiency.
- Log Management and Analysis: Log management and analysis tools collect and analyze log data, crucial for debugging and understanding data flow. They offer enhanced system visibility for prompt problem detection and resolution.
- Performance Monitoring: These platforms focus on system-level metrics such as CPU usage, network bandwidth, and memory utilization, providing insights into the health of the data pipeline infrastructure. This empowers you to optimize system health and peak operational efficiency with real-time insights.
- ETL Monitoring: Designed for ETL processes, these tools ensure data is properly extracted, transformed, and loaded. They enhance data integrity by promptly detecting and resolving issues throughout the data processing lifecycle.
Data Quality & Visualization Tools
- Quality Monitoring: Ensures the data flowing through your pipeline is accurate and reliable. These tools detect anomalies, missing values, and inconsistencies, promoting informed decision-making.
- Workflow Visualization: Simplify complex processes with clear, graphical representations of data flow, dependencies, and potential bottlenecks. These tools empower better decision-making by offering intuitive understanding.
Deployment Monitoring Tools
- Cloud-Native Monitoring: These platforms offer their own monitoring tools tailored to the services they provide, which are deeply integrated with their ecosystem. Cloud-native monitoring services provide seamless scalability, resilience, and integration, hence improving performance in dynamic cloud environments.
- On-Premise Monitoring: These tools offer greater control over data, especially for security or compliance purposes. They can be optimized for an organization’s specific network topology.
- Batch Data Monitoring: Designed for batch processing, these tools track batch job successes, failures, latencies, and data discrepancies. They ensure consistent and timely oversight, mitigating risks associated with data delays or inaccuracies.
Specialized Monitoring Tools
- Custom Monitoring Solutions: Organizations can develop in-house monitoring solutions for unique pipelines. These custom solutions offer tailored oversight perfectly aligned with specific business needs.
- Open-Source Monitoring: Tools like Prometheus, Grafana, or ELK Stack provide a cost-effective and customizable approach. Their open-source nature fosters community-driven development and improvement.
While monitoring offers a vital starting point, data observability goes far beyond. It encompasses a comprehensive view, including: real-time dashboards, automated anomaly detection and alerting, customizable event tracking, historical comparisons to identify deviations, intelligent issue analysis that learns from your data, and even recommended actions to address problems – all working together to ensure your pipeline’s health and efficiency.
As such, you can leverage any combination of these tools to achieve effective pipeline observability, but monitoring key metrics is equally important too. These metrics will reveal the overall health, efficiency, and reliability of your data pipeline observability system.
Key Metrics to Consider for Data Pipeline Observability
Below are the key metrics to ensure your data pipelines are running smoothly and delivering high-quality data:
- Source Throughput Rates: This shows how much data your pipeline can handle in a specific time period. To ensure high throughput, clean data is essential. Check data quality as it enters the pipeline to avoid issues later.
- Sensitive Data Detection Failure Rates: Analyze your data through profiling to find any sensitive information that could be a security risk. It’s important to mask this information from the beginning to prevent breaches as the data travels through the pipeline.
- Error Rates: Keep track of errors and categorize them to understand how data flows. Decide which errors require immediate attention and which can be logged for later review. Have a plan for handling errors, such as restarting the process or rolling back to a previous point, to keep data flowing smoothly.
- Execution Time: Monitor how long each stage of your pipeline takes to complete. This can help identify potential bottlenecks or areas prone to failure. Tracking execution times over time allows you to spot trends and proactively address issues.
- Data Distribution: Data skew refers to data that deviates from the normal pattern and can indicate outliers or trends. Early detection of skew helps identify potential data drift.
- Data Drift: Data drift refers to unexpected changes in the way your data is structured or what it means. There are two main types to monitor:
- Schema Drift: This happens when the structure of your data changes, like adding new fields or modifying existing ones. New systems can introduce schema drift, which might require adjustments to your pipeline.
- Semantic Drift: This occurs when the meaning of your data changes. Tools that manage metadata can help identify these changes by understanding the relationships between different data points.
| METRICS | PURPOSE |
| Source Throughput Rates | Explains how much data can be processed within a given time period. |
| Sensitive Data Detection Failures | Accounts for failure to identify sensitive information. Profiling data at the point of ingestion can remediate this issue. |
| Error Rates | Monitoring errors helps you understand how data moves and identify any problems that might stop it. |
| Execution Time | Tracking how long each step takes can reveal bottlenecks or areas prone to errors. |
| Data Distribution | This shows outliers (unexpected data points) and trends (changes in the data over time) in the distribution of data. These can signal potential issues with your data. |
| Frequency of schema drift | This tracks how often the format of your data changes, like field or data type changes or modifying existing ones. |
| Frequency of semantic drift | This identifies when the meaning behind your data changes, separate from structural changes. |
Choosing the Right Toolset
The ideal data pipeline observability tool depends on your specific needs and constraints. Consider factors like:
- Scalability: Can the tool handle your data volume and complexity?
- Visibility: Does it provide the necessary insights across all stages?
- Reliability: Can you depend on it for consistent monitoring?
By carefully selecting the right tool or combination of tools, you can ensure smooth and efficient data operations. Remember, observability goes beyond just monitoring – it’s about proactive identification, tracking, and resolution of issues for optimal data pipeline performance.
Why DQLabs?
DQLabs equips you with data pipeline observability by providing features that address core monitoring and data quality needs. It offers end-to-end data lineage tracking for clear visibility into data flow; automated data quality checks and anomaly detection to ensure data accuracy. DQLabs goes beyond simply detecting schema drift by providing analysis reports and recommendations for handling these changes.
DQLabs prioritizes data quality with a wide range of pre-built and customizable checks. Shift-left and right capabilities enable data quality checks both before data enters the warehouse and after it’s loaded. DQLabs even integrates with data catalogs to maintain consistent structure information.
Flexibility is another key strength. DQLabs allows users to define custom data quality rules and integrates with various data sources and tools. AI and machine learning are leveraged for automated data quality checks, rule generation, and root cause analysis. Overall, DQLabs acts as a comprehensive platform that aligns with various data pipeline observability aspects, ensuring data consistency and quality throughout the pipeline.
Experience DQLabs firsthand. Schedule a personalized demo today.
FAQs
-
What is data pipeline observability?
Data pipeline observability refers to the ability to track, analyze, and understand the health and performance of data as it moves through various stages of a pipeline. It involves collecting and analyzing metadata, logs, and metrics to provide visibility into how data is ingested, transformed, and delivered. Effective observability helps identify anomalies, resolve issues, and ensure data quality and pipeline reliability.
-
How does data pipeline observability differ from data monitoring?
While data monitoring involves tracking predefined metrics and setting alerts for known issues, data pipeline observability goes deeper by offering a holistic view of the pipeline’s internal state. Monitoring answers “Is something wrong?” while observability answers “Why is it wrong?” It enables root cause analysis, detects unknown issues, and provides insights across data quality, schema changes, and performance bottlenecks.
-
Why is observability crucial for modern data pipelines?
Modern data pipelines handle vast, fast-moving, and complex data from multiple sources. Without observability, issues like data loss, schema drift, and inconsistent transformations can go undetected, leading to poor decision-making and operational disruptions. Observability ensures data accuracy, accelerates issue resolution, and helps maintain trust in analytics and AI-driven initiatives.
-
What are the key components of effective data pipeline observability?
Effective data pipeline observability relies on four key components:
- Data Quality Metrics – Monitoring freshness, completeness, accuracy, and consistency.
- Schema Tracking – Detecting schema changes and ensuring compatibility across systems.
- Operational Metrics – Analyzing job performance, error rates, and latency.
- Root Cause Analysis– Tracing issues back to their origin for faster resolution.