
Summarize and analyze this article with
Have you ever started a data project only to realize that your datasets contain inconsistencies, missing values, or duplicates? Poor data quality can derail data migration, master data management, or analytics initiatives, leading to inaccurate insights and costly errors. This is where data profiling comes in.
Data profiling provides a structured approach to understanding your datasets before you use them. It offers a comprehensive overview of data contents and statistics, helping organizations assess the quality and usability of their data.
What you will learn
- Why Data Profiling Is Foundational for Data Quality
- Poor data quality—missing values, duplicates, inconsistencies—can derail analytics, migrations, and MDM initiatives.
- Data profiling provides a structured way to assess datasets before use, revealing quality issues and enabling proactive remediation.
- Key techniques include structure discovery (data types & formats), content discovery (nulls, uniqueness, systemic errors), and relationship discovery (cross-dataset links).
- Profiling steps: data preparation → discovery → standardization → cleansing → continuous improvement for long-term data health.
- Enables trustworthy analytics, smoother data integration, and better governance across cloud, CRM, and ERP systems.
- For reliable insights, data profiling must be a built-in step—not an afterthought.
What Is Data Profiling?
According to Gartner,
Data profiling is a technology for discovering and investigating data quality issues, such as duplication, lack of consistency, and lack of accuracy and completeness. This is accomplished by analyzing one or multiple data sources and collecting metadata that shows the condition of the data and enables the data steward to investigate the origin of data errors. The tools provide data statistics, such as degree of duplication and ratios of attribute values, both in tabular and graphical formats.
Essentially, data profiling serves as a data hygiene process, resulting in a collection of metadata that reflects the overall health of your data. Key aspects of data profiling include:
- Data types: Are the values in a column numbers, text, or dates?
- Value ranges: What’s the minimum and maximum value a field can hold?
- Missing values: How many data points are missing in a specific column?
- Data distributions: How are the values distributed across a column?
- Data relationships: Are there any connections between different data points or columns?
- Data quality issues: Are there any inconsistencies, duplicates, or errors present?
By leveraging data profiling tools and techniques, businesses can proactively detect data issues and improve data quality, ensuring reliable analytics and decision-making.
Why Is Data Profiling Important?
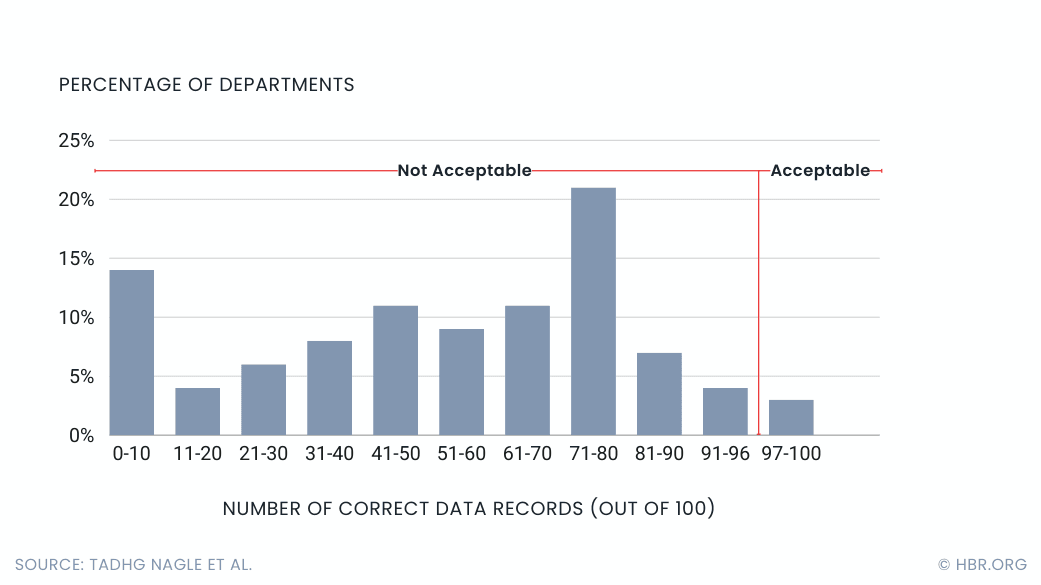
If you jump into a data project without first understanding your data, you’re setting yourself up for failure. The truth is, only about 3% of a company’s data is actually considered high quality. Data profiling helps you tackle these problems head-on by giving you a clear picture of your data before you start using it.
Using data effectively requires a deep understanding of its content, quality, and structure before it’s integrated into applications like cloud data warehouses, CRM, or ERP systems. Unfortunately, projects often fail or take much longer than expected because they rely on outdated or inaccurate information about the data. This can waste a lot of time and effort, and ultimately put the project at risk.
The sheer complexity of databases, the massive amounts of data involved, and the difficulty of manually understanding source data all make data profiling a crucial step.
Data profiling helps ensure high-quality and reliable data by allowing businesses to verify its characteristics, identify any quality issues, and make sure it meets both statistical standards and their own specific business rules. By performing data profiling regularly, companies can build a strong foundation for data governance, ensuring their data is always reliable and trustworthy.
Types of Data Profiling
Data profiling employs three main techniques: structure discovery, content discovery, and relationship discovery. While their methods vary, the goal is the same—enhancing data quality and understanding your data assets.
Structure Discovery
Structure discovery examines how data is formatted and organized. It’s like taking a census of your dataset, identifying field types and their content. This ensures consistency—e.g., a phone number field shouldn’t contain text or an incorrect number of digits.
Techniques like pattern matching help detect formatting inconsistencies, such as missing digits in phone numbers. Basic statistical analysis (e.g., minimum, maximum, and average values) helps validate data accuracy. For example, an age field with a minimum value of -5 would be unrealistic. By combining these methods, structure discovery ensures consistency and correctness, forming a solid foundation for analysis.
Content Discovery
Content discovery focuses on examining individual fields to assess data quality. It identifies errors and determines systemic issues within datasets.
For instance, in a user database, content discovery would highlight the percentage of phone numbers missing area codes. This process improves understanding by pinpointing gaps and inconsistencies in data formatting, standardization, and integration.
Key content profiling techniques include:
- Statistical summaries: Analyzing minimum/maximum values in numerical fields and frequency distributions in categorical fields.
- Null values and uniqueness: Checking for nulls, blanks, and unique values to gauge completeness and relevance.
- Systemic errors: Detecting issues like misspellings or inconsistent formats (e.g., “Doctor” vs. “Dr.”).
Relationship Discovery
While structure and content discovery focus on individual datasets, relationship discovery analyzes connections between different data sources. For example, separate department datasets may share a common identifier, like a customer ID.
This process examines metadata to uncover links between database tables, spreadsheet references, or formulas aggregating data from multiple sources. Understanding these relationships improves data warehouse efficiency and ensures data transformation aligns with business needs.
By leveraging these three techniques, organizations gain a clearer picture of data quality, making it easier to manage and optimize their datasets.
How Does Data Profiling Work?
Data profiling aims to create a complete picture of your data’s current state. This includes accurate metadata and comprehensive metrics, allowing you to understand the data’s true content and quality. Following the below steps will help your data analysts take necessary actions to ensure the data is fit for its intended purpose in the target system.
Step 1: Preparation
Data profiling starts by prepping the data source for analysis. Tools like DQLabs can handle massive datasets (hundreds of millions of rows) from various sources, including Amazon S3, Snowflake, Google BigQuery, ODBC, Oracle, Salesforce, and more.
Step 2: Data Discovery & Profiling
This phase focuses on structure, content, and relationships, mapping out the data landscape. Profiling creates a report card for each dataset, detailing data types, missing values, and storage priorities. Frequently used data is kept in high-cost storage, while less critical data is stored in lower-cost options.
Modern tools like DQLabs offer advanced data profiling, allowing users to filter and drill down on records for better problem detection. Analysts can also perform “What-If” scenarios, integrating profiling with cleansing, standardization, and parsing functionalities.

Step 3: Standardizing
After you figure out what you have and how to find it, the next step is standardizing. Ensure that similar data matches across tables and databases. This includes standardizing formats, such as converting dates from different formats to a standard format.
Step 4: Cleansing
Data cleansing takes the next step by fixing formatting errors to match your new standardization rules. It also tackles bad data, removing corrupt or completely worthless entries. By following robust data profiling practices and maintaining backups, you can minimize the risk of further data loss during this process.
Step 5: Continuous Improvement
Fixing data issues in isolated applications provides only temporary relief. A long-term solution requires an enterprise-wide strategy, involving IT and business teams.
Empowering data stewards and analysts fosters data ownership, maximizing the value of reliable data. Profile comparisons over time help track data quality improvements and ensure ongoing data health.
DQLabs’ offers in-place profiling techniques with one of the fastest and deepest pushdown options to all modern data stack systems. Interested to know more? Let’s chat!
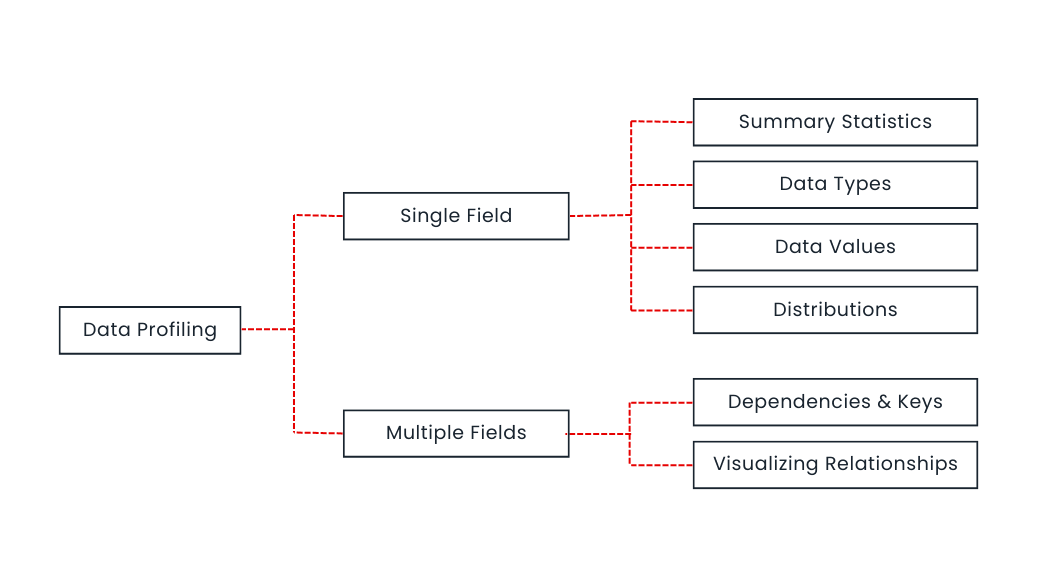
Techniques to do Data Profiling
Single Field Profiling
This basic technique treats each data field in isolation. Think of it like inspecting individual items in a cluttered room.
It reveals:
- Summary Statistics: Counts data entries and calculates basic statistics like minimum, maximum, and average values.
- Data Types: Identifies if the data is categorical (like gender), continuous (like temperature), or follows specific formats (dates, timestamps).
- Data Values: Shows characteristics and patterns within data, like identifying invalid entries or verifying data against business rules.
- Distributions: Visualizes how data is spread out, helping identify outliers or unusual patterns.
Multi-Field Profiling
This technique goes beyond individual fields and explores relationships between them. Imagine finding connections between items in your room.
It reveals:
- Relationships: Discovers if values in one field depend on or limit values in another.
- Numerical Relationships: Visualizes connections between numerical fields using graphs and heatmaps, highlighting potential correlations.
Metadata Discovery
Besides the traditional classification of profiling tasks, the below are the common ways to discover metadata for profiling:
- Automatic Data Flow: Automatically maps how data moves through systems, finding connections between tables and columns.
- Column Profiling: Counts how often each value appears in a specific column, revealing data frequency and patterns.
- Cross-Column Profiling: Analyzes values across multiple columns, identifying potential primary keys and dependencies between data points within a table.
- Cross-Table Profiling: Examines relationships between columns in different tables, helping detect redundancies and connections.
- Data Rule Validation: Data rule validation checks if data adheres to predefined rules, ensuring data quality.
Benefits of Data Profiling
While data profiling comes with challenges—handling large data volumes and fragmented storage—it offers undeniable benefits.
Enhanced Clarity and Collaboration
Data profiling works alongside data catalogs, which store metadata like definitions, lineage, and ownership. Linking metadata with profiling details provides a comprehensive view of data assets. This fosters collaboration, enabling stakeholders to share insights and improve data governance.
Streamlined Workflows and Better Decisions
Data profiling tools automate discovery and metadata management, eliminating manual tasks. This frees data professionals to focus on strategic initiatives while ensuring cleaner, more accurate data for better decision-making.
Organized Data Landscape and Future Planning
Databases often contain overlapping or scattered information. Data profiling traces data to its source, ensuring proper organization and eliminating confusion. Analyzing data relationships helps organizations set realistic goals and improve long-term planning.
Best Practices for Data Profiling
The key initial step is to utilize data profiling as a tool. Data experts frequently overlook its benefits when addressing quality issues or developing new data products. Once you’ve decided to implement profiling, you should:
- Focus Your Efforts: Define the scope and specific data assets you want to analyze. This ensures targeted profiling.
- Set Clear Rules: Establish data profiling rules to analyze the right elements, focusing on completeness, consistency, accuracy, and validity.
- Go Beyond Averages: Use multiple techniques like statistical analysis and pattern matching for a deeper understanding of your data.
- Validate Your Findings: Compare your results to expected outcomes and identify potential errors in your profiling process.
- Collaborate for Accuracy: Share results with your team and incorporate feedback from data stewards to refine your analysis and build trust in the data.
Your profiling technique will largely depend on your use case and objectives. After reviewing the basic profile, consider the following questions to determine your next steps:
- Do you need to explore cross-column profiling to identify deeper relationships?
- Should you define and add a data quality rule to the profile to enforce data quality?
- Do you need to find overlap between two tables and use cross-table profiling?
- Is adding metadata necessary to organize information within a data lake?
- Do you need to ensure a smooth data migration from one system to another?
A good data profiling will help you answer the following questions:
- Is our data good enough to finish the project on time and budget?
- Does it align with our business needs?
- Cost-effective to maintain and use?
- Accurate and reflects real business needs?
- Can data elements work together for our goals?
- Can we create reports with this data?
- What data needs cleaning or transforming?
- Will the final data be reliable?
Use Cases for Data Profiling
1. Building Reliable Data Products
Before building models or analyzing data, data profiling ensures your foundation is strong. It reveals data types, formats, and potential issues, saving engineers time and improving data product quality.
2. Streamlining Data Integration
When merging datasets, understanding their relationships is crucial. Data profiling helps identify connections and inconsistencies, enabling smoother integration and accurate insights.
3. Optimizing Queries
Data profiling creates detailed statistics about your data, allowing databases to optimize queries and return results faster. This translates to quicker access to valuable information.
4. Strengthening Data Governance
Data governance encompasses data quality, security, and compliance. Data profiling helps organizations understand their data landscape, including data lineage and ownership. This helps data stewards to develop effective data policies and ensures data is used responsibly.
5. Resolving Data Quality Issues
Data profiling acts as a detective, pinpointing anomalies and data inconsistencies quickly. This allows data professionals to identify and fix problems efficiently, avoiding time-consuming “data hunts.”
6. Building and Managing Data Pipelines
Data profiling empowers data engineers by revealing data types, rules, and cleaning needs. This information helps them build efficient data pipelines and cut development time in half.
7. Facilitating Data Migration
Data profiling plays a crucial role in planning and executing data migrations. By assessing data conditions early on, developers can predict effort levels and ensure smooth transitions to new systems.
Live Examples
Following are some of the examples of companies who leveraged the advantages of data profiling to improve their operational efficiency:
Office Depot
Operating both online and in-store, Office Depot relies on seamless data integration. Data profiling ensures high-quality data across all channels – offline catalogs, websites, and call centers. This complete 360-degree customer view empowers them to tailor offerings and optimize back-office functions.
Globe Telecom
Globe Telecom, a telecommunications giant in the Philippines, needed to maximize the value of existing customers. However, data quality challenges hindered this goal. Manual data scoring, using spreadsheets and offline databases, proved insufficient. Data profiling and cleansing solutions helped Globe establish a data center of excellence. This resulted in daily data quality scores (previously monthly), a 400% increase in trusted email addresses, and a significant boost in marketing campaign ROI with cost reductions, improved conversion rates, and higher click-through rates.
Conclusion
Data profiling is no longer an optional step – it’s a fundamental requirement for any organization seeking to get the most out of their data. By providing clarity on data content, relationships, and quality, data profiling streamlines workflows, facilitates better decision-making, and lays the groundwork for strong data governance procedures.
Experience DQLabs’ on-the-fly profiling firsthand. Schedule a personalized demo today.
FAQs
What is the main purpose of data profiling?
The main purpose of data profiling is to analyze, assess, and understand the structure, quality, and characteristics of a dataset before it is used for data migration, integration, or quality initiatives. It helps identify issues such as missing values, inconsistencies, duplicates, and incorrect data formats, ensuring better decision-making and data governance.
How is data profiling different from data mining?
Data profiling focuses on analyzing the structure, quality, and completeness of data, providing insights into metadata such as data types, value distributions, and relationships. In contrast, data mining is about discovering patterns, trends, and correlations within large datasets to extract meaningful insights for business intelligence and predictive analytics.
What are the key challenges in data profiling?
Some common challenges in data profiling include:
- Handling large datasets: Analyzing vast amounts of data efficiently can be resource-intensive.
- Data inconsistency: Poorly structured data with missing or incorrect values makes profiling complex.
- Scalability: As data grows, profiling processes must scale without affecting performance.
- Data privacy and security: Profiling sensitive data requires compliance with regulations like GDPR and HIPAA.
- Integration with multiple sources: Data exists in different formats across various systems, making comprehensive profiling challenging.
Which industries benefit the most from data profiling?
Data profiling is valuable across various industries, including:
- Healthcare: Ensures accurate patient records and regulatory compliance.
- Finance: Improves fraud detection and risk management.
- E-commerce: Enhances customer data quality for better personalization.
- Manufacturing: Supports supply chain optimization and inventory management.
- Government & Public Sector: Helps maintain clean, reliable data for policymaking and services.