Organizations that want to implement data-driven decision-making know that their business decisions are directly influenced by the quality of their data. Data and business teams are well versed with the “garbage in, garbage out” mantra that highlights the importance of quality data for enterprise data initiatives. However, organizations still follow a reactive approach to data quality management where downstream data consumers find data issues and update data teams about them. With this approach, organizations lose crucial time to fix data errors that might sometimes take days or weeks.
Organizations need a proactive approach to their data quality management, and timely anomaly detection is crucial for that. In this blog, we’ll understand anomaly detection, its impact, and use cases. Let’s dive right into it with a definition!
Data anomaly detection refers to the process of identifying data points that are significantly different from standard or expected data. Being significantly different from other data points, these flag the possibility of outlier events.
Anomaly Detection Process
Before we dig deeper into the anomaly detection process, let’s first understand basic data quality rules. Data quality rules ensure that data that doesn’t meet defined criteria, gets flagged. Let’s take the example of a pension fund database. As per the defined company criteria for that pension fund, all the members buying into the fund should be above 60 years old. In this instance, the company would require a DQ rule, which ensures the following – if a particular member’s age is less than 60 years old, the rule automatically categories it as an invalid record, eliminating the need for any manual intervention.
Data quality rules are extremely effective and core to the data quality management process for any organization. However, writing and configuring DQ rules to comprehensively cover all possible deviations in data is neither a practical nor a scalable option. The good news is that there’s a better way to do this – AI/ML-based anomaly detection.
An AI/ML-based anomaly detection tool automatically anticipates potential deviations. Based on the historical data trends, the tool highlights an expected value range of datasets. If the actual value deviates from the expected value, the tool triggers an alert to notify the users about the data anomaly. A user can also train the model by marking an alert as “acceptable” or “outlier” and the ML mechanism would take this as input for future calculations.
Let’s take the example of a retail customer who uses an AI/ML-driven anomaly detection tool to monitor its website’s traffic patterns. Historical data shows that during December, traffic typically ranges from 10,000 to 15,000 visits per hour due to holiday shopping. If traffic unexpectedly drops to 2,000 visits per hour during this peak period, the system triggers an alert for an investigation into potential technical issues or customer behavior changes. Conversely, if traffic spikes to 30,000 visits per hour outside of expected promotional periods, such as in April, the system also alerts, indicating possible marketing success or an influx of unexpected demand. This proactive approach allows the IT team to maintain website performance, investigate issues promptly, and optimize resource allocation based on real-time insights.
Notice here that users don’t have to configure any DQ rules. AI/ML-driven anomaly detection mechanism automatically creates a baseline data metric and continuously monitors it to find any data anomalies.
Impact of Data Anomaly
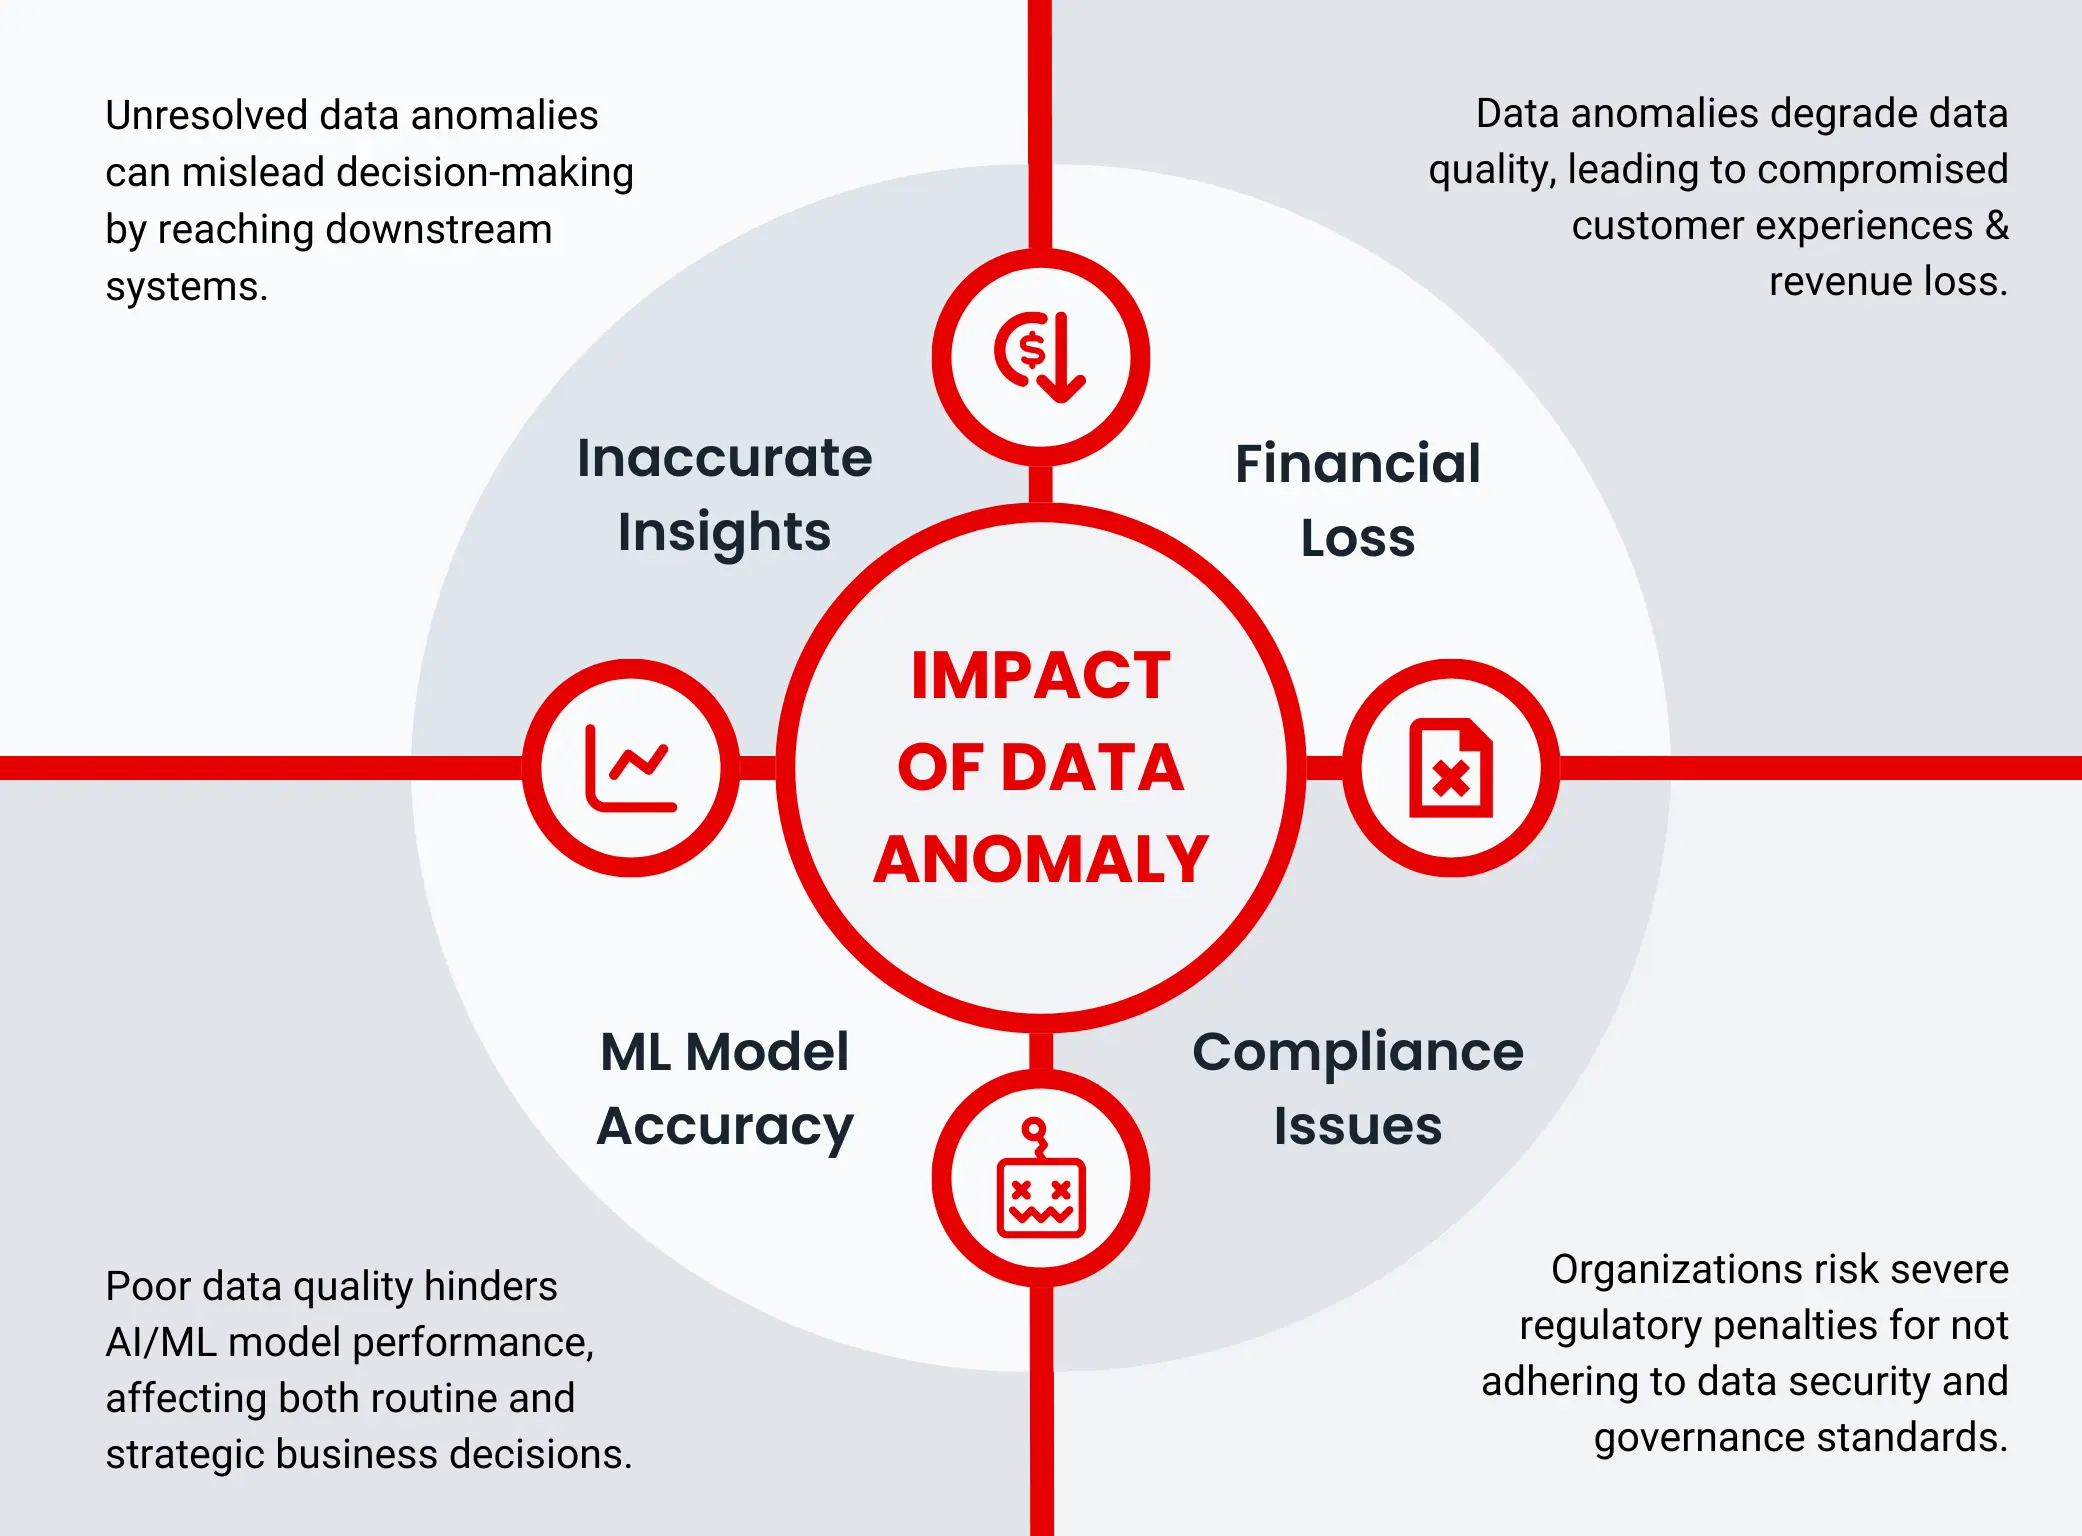
Data anomalies can have a significant impact on organizations. Some of the negative impacts are as follows:
Inaccurate insights: Data anomalies, if not identified and resolved timely, would reach downstream systems and applications. This will result in misguided decision-making.
Financial loss: Data anomalies lead to poor data quality and the cost of poor data quality can be catastrophic for companies, ranging from compromised customer experience all the way to loss of revenue.
Compliance issues: Organizations can face severe penalties from regulators for non-compliance with industry standards of data security and governance.
ML model accuracy: Poor data quality can affect the performance of AI/ML models significantly. Often these models are used for business-as-usual rules (say, how marketing material should be displayed) or even for strategic decision-making (which user groups to target for maximum conversion), both of which can be severely impacted by poor data quality.
Types of Anomalies
Anomalies can be categorized into several different categories. We’ll discuss some common types of data anomalies.
Point anomalies: Data points with a notable deviation from the rest of the data are called point anomalies. For example, a dataset containing temperature data may have a sudden spike or dip that is not aligned with the weather seasonality. Another example could be an unusually high-value transaction that is not aligned with a user’s normal transaction patterns.
Contextual anomalies: Contextual anomalies refer to data points that deviate from different data points within a specific context. These anomalies are not necessarily outliers in their specific context but become anomalous data points if the context changes. To quote an example – imagine an e-commerce company that sees a spike in its web traffic without the introduction of any new promotional campaigns. Contextually, this is an anomaly. However, this wouldn’t have been classified as an anomaly, had the web traffic increase been driven by campaigns on the website or say, some new discounts being offered.
Collective anomalies: In collective anomalies, a subset of data points together deviate from the rest of the dataset. Individually, these data points might appear normal but by comparing the subset points with the rest of the data, users would be able to identify and track these anomalies. For example, a retail chain that has multiple stores across different regions may suddenly notice a significant drop in its sales figures. In this case, the anomaly is not tied to any individual retail store but is seen across all the stores. Surely, the reasons cannot be attributed to a particular store, but rather to some other factors that seem to be impacting the entire business of this retail chain. These reasons might be changes in consumer preferences, negative brand image in the region, macroeconomic factors, or region-wise operational issues.
Use Cases of Anomaly Detection
Banking and finance sector: Fraud detection in financial transactions is one of the most popular use cases of anomaly detection. Anomaly detection algorithms identify unusual transaction patterns, withdrawals from unexpected locations, and unauthorized transactions. Detection of these data anomalies helps banks to detect and prevent fraudulent activities.
E-commerce: Anomaly detection is used in e-commerce industries to identify unusual customer behavior and improve inventory management. For example, if there’s a sudden spike in the demand for a particular product that usually has low demand, it’s an outlier event. E-commerce companies can analyze this and maintain higher inventory levels than usual to meet the demand for the product. In addition to this e-commerce companies use anomaly detection to track abnormal purchase patterns, bulk volume orders, and fraudulent account access activities.
Healthcare: In the modern healthcare world, anomaly detection can significantly improve patient care. Healthcare providers can use anomaly detection systems that track unusual health metrics in real-time to flag medical emergency requirements. For healthcare insurance providers, anomaly detection provides a mechanism to detect fraudulent billing claims and maintain the integrity of their claim reimbursement process.
Manufacturing industry: Anomaly detection is used in manufacturing industries to identify deviations from normal operating conditions that can affect product quality during the production process. This way, manufacturing firms can maintain high product quality, prevent unexpected machine or operational downtime, ensure asset reliability, assure timely asset maintenance & longer asset life, and reduce wastages in the production process.
Benefits of Anomaly Detection
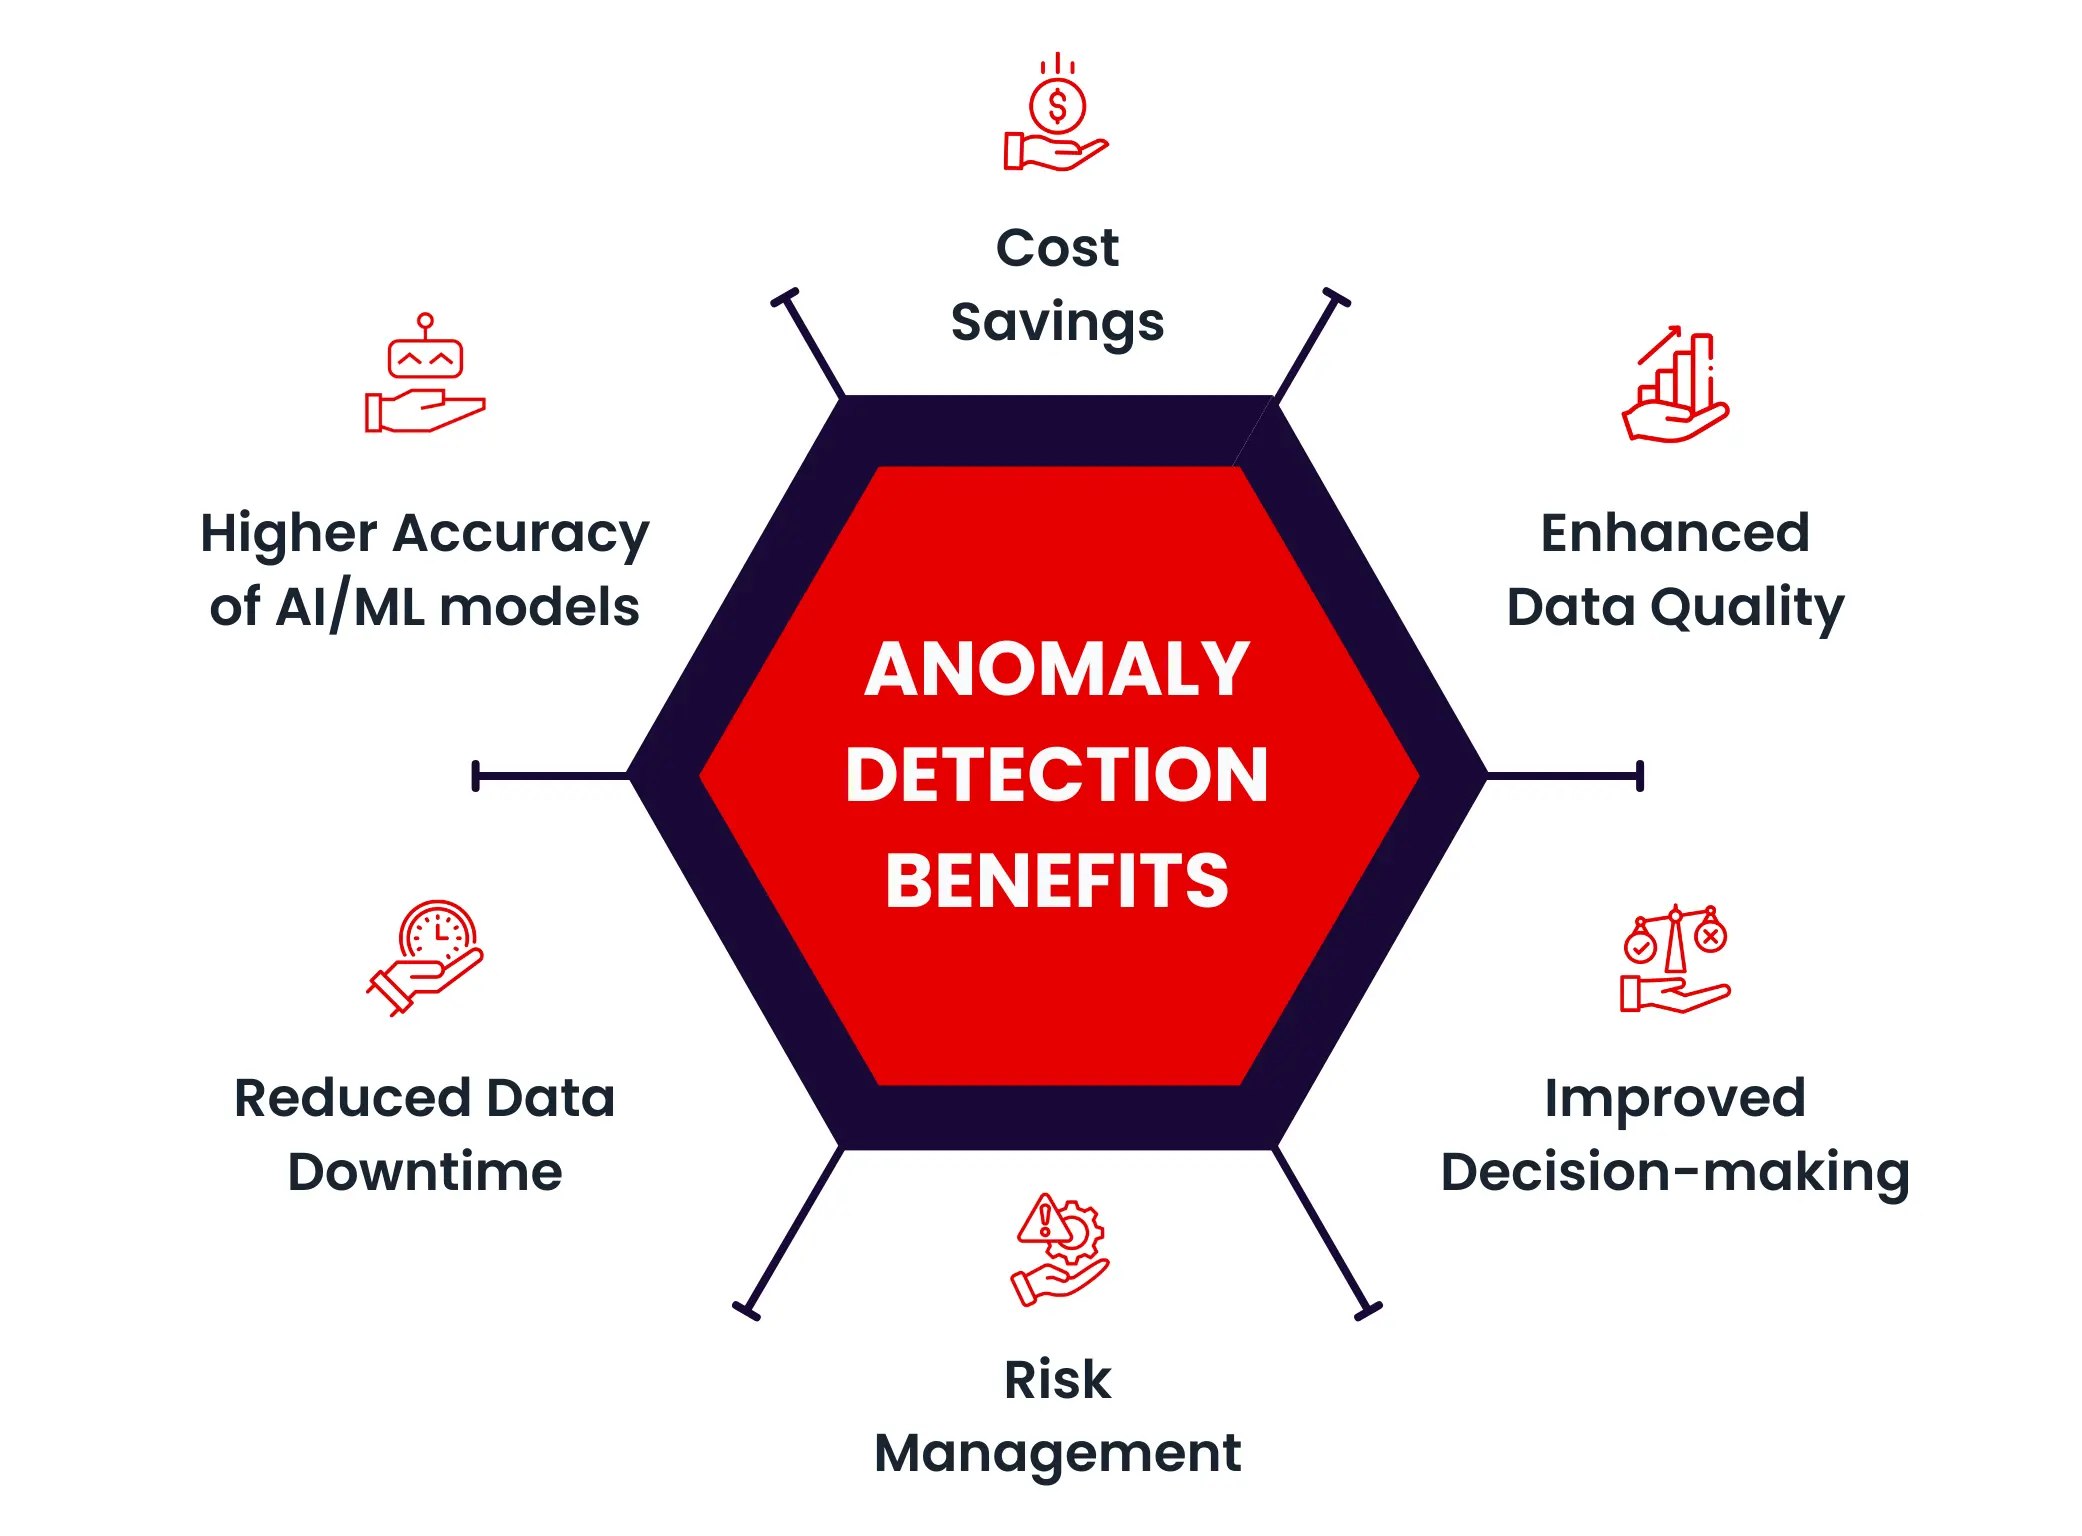
Enhanced data quality: Efficient handling and management of data anomalies and outliers is crucial for organizations’ data quality management initiatives. Effective anomaly detection and resolution process ensures the delivery of high-quality and trustworthy data.
Improved decision-making: Organizations’ business decisions can only be as good as their data is! Data and business users can trust their analysis only if their analyses are backed by high-quality data driven by efficient handling of anomaly detection practices.
Risk management: Anomaly detection is crucial to detect and stop fraudulent activities in any sector, especially in insurance and finance. Timely identification and resolution of fraudulent activities empower businesses to manage these risks proactively.
Reduced data downtime: Data downtime refers to the period in which your data is incomplete, inaccurate, and inconsistent, which affects the timely consumption of it by various downstream users. By detecting anomalies before they affect downstream users, organizations can significantly reduce the costs of poor data quality when it is already in production (to run ML models) or worse, already displayed to the consumer, the customer or to leadership teams making data-dependent decisions.
Higher accuracy of AI/ML models: Slowly but surely, organizations are accepting that their AI initiatives can’t be sustained without high-quality data. Outliers and anomaly detection improve the quality of input data to AI/ML models (enabling data scientists to treat outliers correctly), thus improving the accuracy of these models.
Cost savings: The cost of poor data quality can really be catastrophic for organizations. According to Gartner, poor data quality costs organizations an average of $12.9 million. By ensuring data quality with anomaly detection, organizations can reduce the cost implications associated with poor data quality.
Data Anomaly Detection with DQLabs
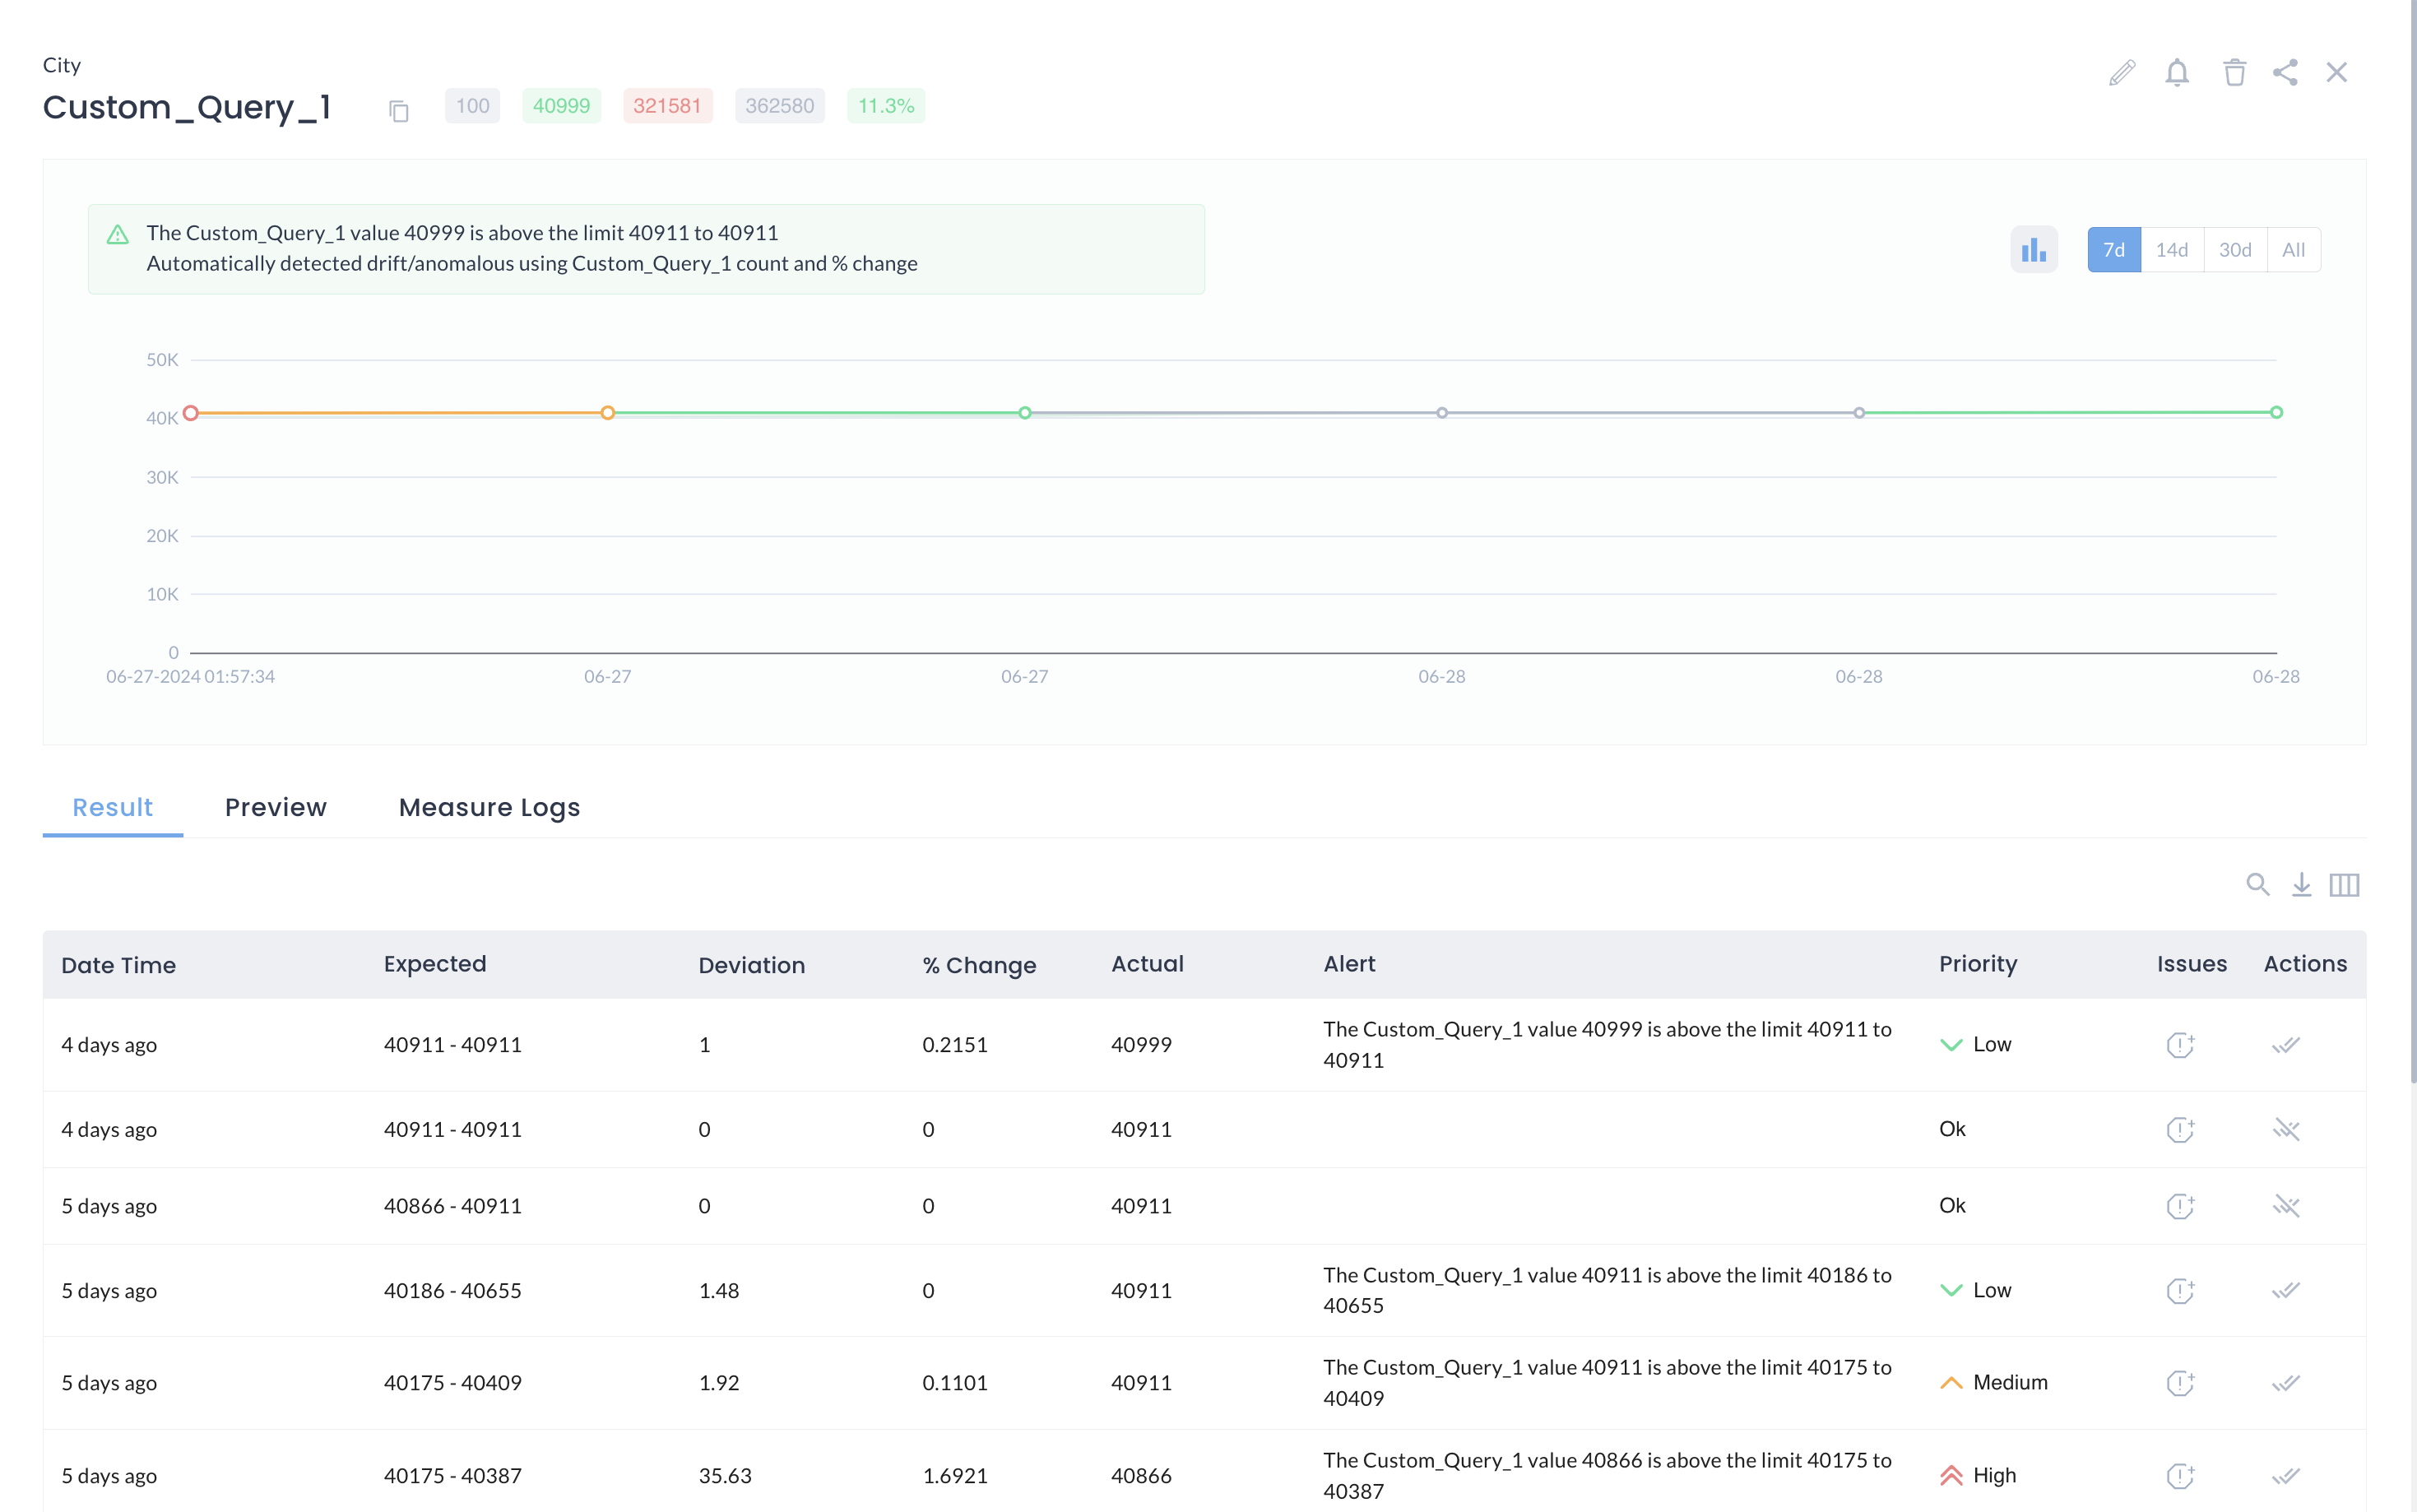
DQLabs, the Modern Data Quality Platform, empowers users with AI/ML-driven anomaly detection to maintain high data quality standards. DQLabs’ anomaly detection mechanism detects an expected value range of data flow based on historical trends and calculates the deviation from the benchmark. If the actual value is different from the expected value range, the platform provides a deviation and if the deviation is not in the expected value range it will trigger an alert. The unique value proposition here is that based on the deviation percentage, DQLabs will automatically set the priority of the alert (high, medium, or low), which will help users to focus on priority alerts and start addressing data anomalies accordingly.
DQLabs provides the following unique capabilities and features for efficient anomaly detection and resolution.
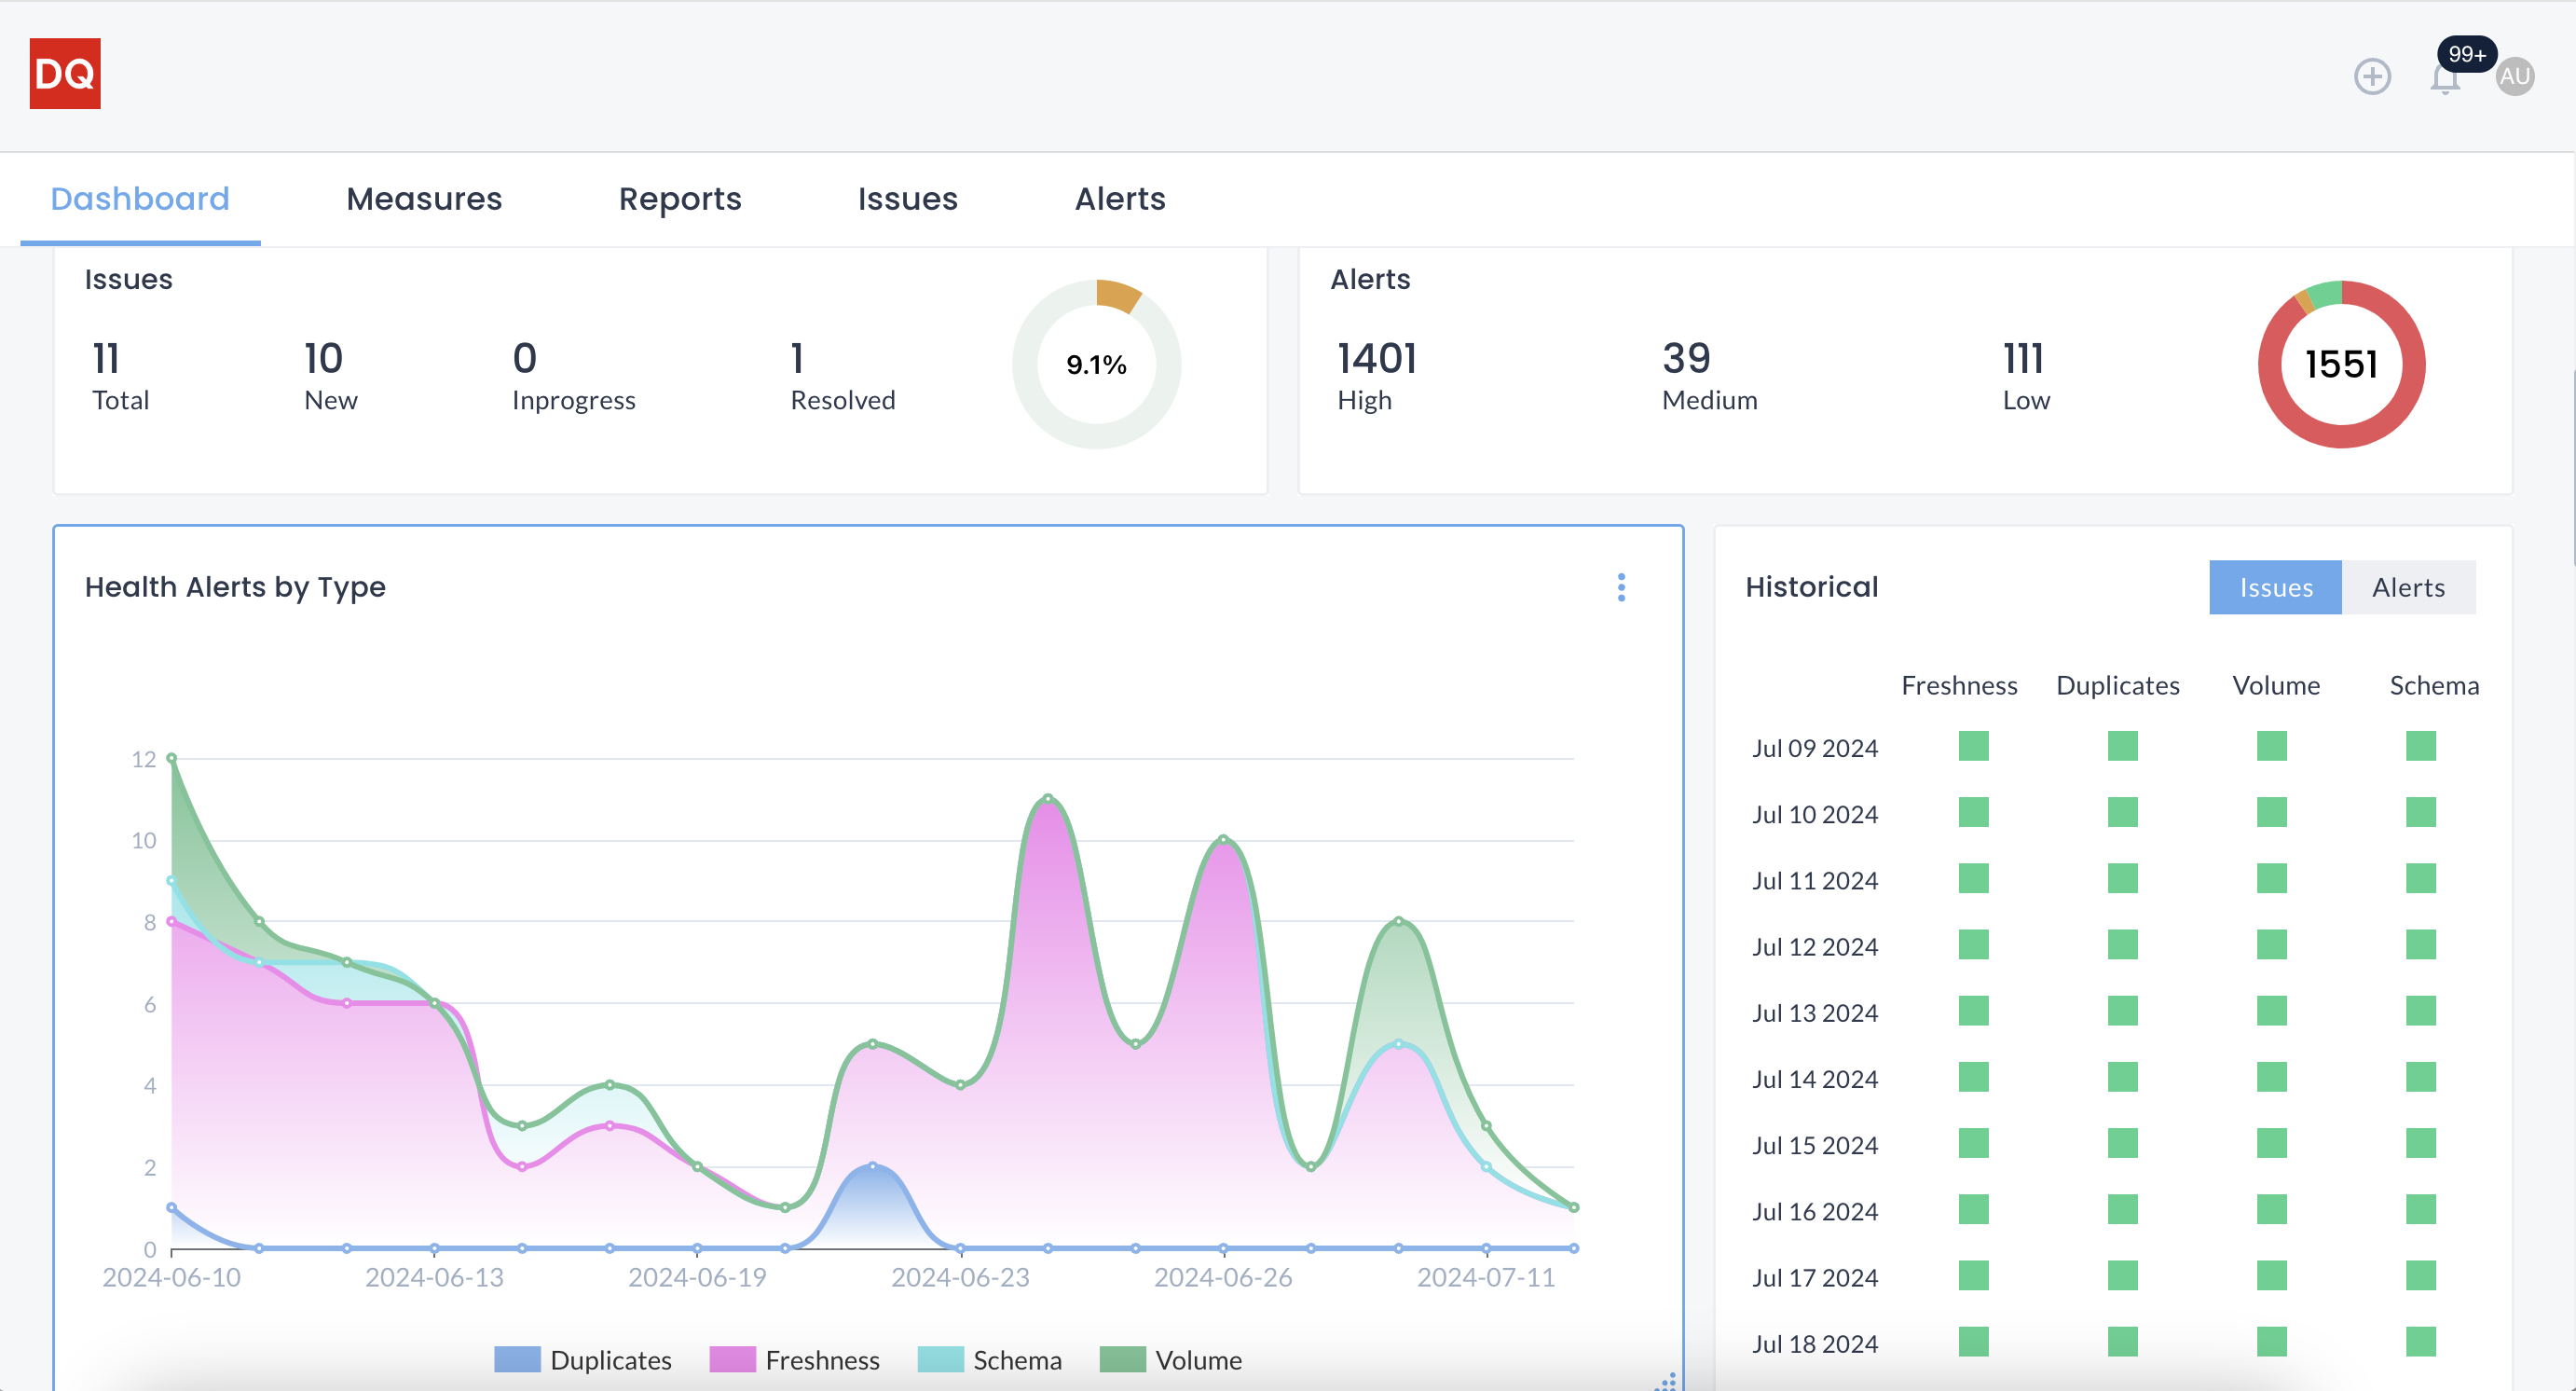
Dashboard Overview
DQLabs provides a dashboard for users to access the summary of all data anomalies. This dashboard provides users with a snapshot of their data systems’ health by categorizing anomalies based on data completeness, uniqueness, freshness, and consistency. This provides a unique view of an enterprise data system’s health to data and business users.
Alerts Prioritization
With the AI & ML enabled anomaly detection process, DQLabs automates the process of data quality issue tracking. Based on the deviation from standard data, DQLabs set the priority of the alerts (high, medium, and low), prioritizing alerts and optimizing users’ time.
Alerts Customization
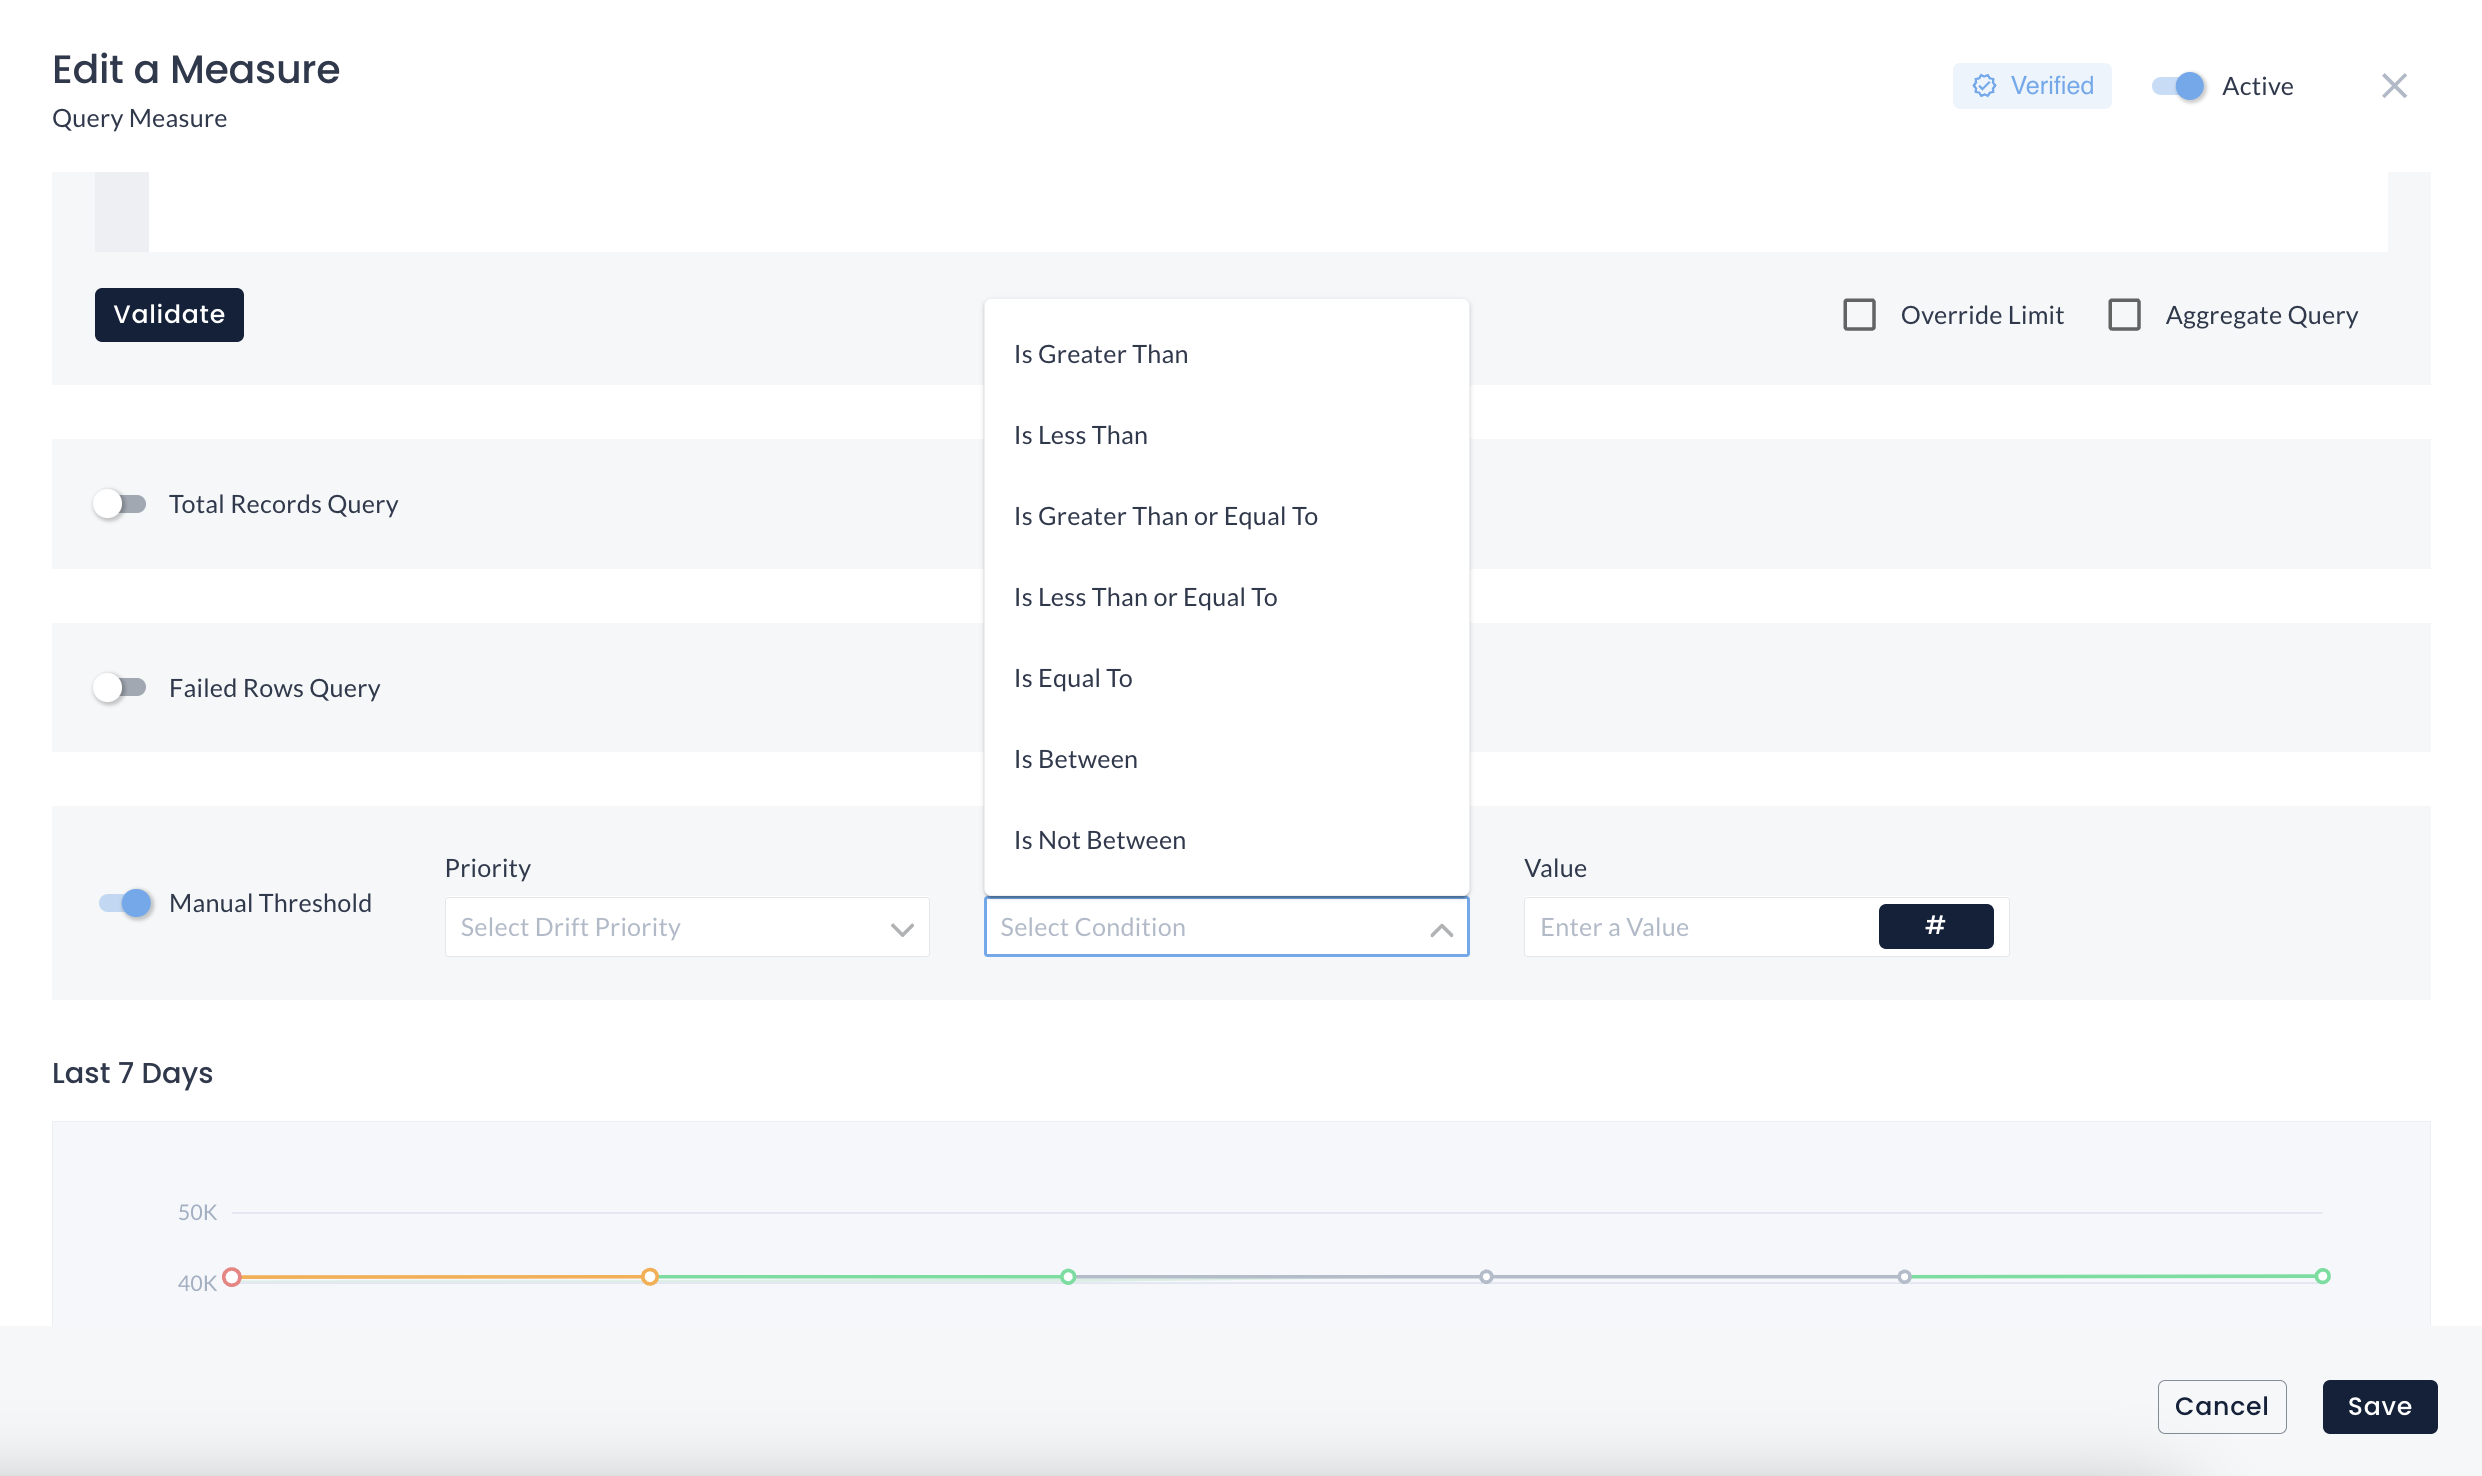
DQLabs’ anomaly detection capability is not limited to the AI & ML-based default configuration. DQLabs empowers users to select the manual threshold as per their specific dataset requirements. For example, if the row count deviation is 20%, but as per the use case, a 35% deviation is acceptable to users, they may manually set the deviation to 35%. This way, users won’t get unnecessary alerts, and users can better manage relevant data anomalies.
Conclusion
Effective anomaly detection is pivotal for organizations aiming to harness the full potential of their data. By adopting proactive data quality management practices, businesses can swiftly identify and mitigate anomalies before they impact decision-making and operations. This approach not only enhances data accuracy and reliability but also supports informed decision-making, mitigates financial risks, and improves operational efficiency.
DQLabs exemplifies this proactive approach with its AI/ML-powered anomaly detection capabilities. By providing real-time insights and customizable alert prioritization, DQLabs enables organizations to maintain high data quality standards and minimize the impact of anomalies on business outcomes. Embracing advanced anomaly detection is not just about managing data effectively—it’s about empowering organizations to drive innovation, manage risks proactively, and optimize performance across all sectors of their operations.